В этом руководстве мы будем использовать плагин jQuery Charts Plotting JQplot , чтобы создать новый плагин WordPress, который может отображать часть трафика вашего блога, популярные категории и многое другое с некоторыми красивыми визуальными диаграммами. Ищете способ вырубить инструментальную панель клиента (или свою собственную!) С помощью некоторой полезной инфографики? Не смотрите дальше … мы покажем вам, как это делается прямо здесь.
Шаг 1 Создание темы:
В качестве библиотеки диаграмм jQuery мы выбираем JQplot, который прост в использовании и с открытым исходным кодом под лицензиями GPL, MIT. В этом посте мы дадим 4 разных графика, но затем, используя нашу фантазию, вы сможете создать больше диаграмм, связанных с данными вашего сайта WordPress. Мы назовем наш плагин Infograph. Вы можете скачать и установить готовый плагин по ссылке на скачивание, приведенной в этом посте. Теперь давайте рассмотрим структуру плагина шаг за шагом: плагин содержит 6 функций (1 для скриптов JS, одну для CSS и 4 для диаграмм), 4 шорткода для диаграмм и 2 хука действий. Я надеюсь, что вы все знаете, что такое шорткод и действие, так что давайте продолжим.
Сначала мы добавим 2 функции для добавления поддержки JS и CSS:
|
01
02
03
04
05
06
07
08
09
10
11
12
13
14
15
16
17
18
19
20
21
22
23
24
25
26
27
28
29
30
31
32
33
34
35
36
37
|
function myscripts ()
{
wp_deregister_script(‘jquery’);
wp_register_script( ‘jquery’,get_bloginfo(‘wpurl’) . «/wp-content/plugins/infograph/jquery-1.3.2.min.js»);
wp_enqueue_script(‘jquery’);
wp_register_script( ‘jqplot’,get_bloginfo(‘wpurl’) . «/wp-content/plugins/infograph/src/jquery.jqplot.js»);
wp_enqueue_script( ‘jqplot’ );
wp_register_script( ‘bar’, get_bloginfo(‘wpurl’) . «/wp-content/plugins/infograph/src/plugins/jqplot.barRenderer.js»);
wp_enqueue_script( ‘bar’ );
wp_register_script( ‘cax’, get_bloginfo(‘wpurl’) . «/wp-content/plugins/infograph/src/plugins/jqplot.categoryAxisRenderer.js»);
wp_enqueue_script( ‘cax’ );
wp_register_script( ‘pol’, get_bloginfo(‘wpurl’) . «/wp-content/plugins/infograph/src/plugins/jqplot.pointLabels.js»);
wp_enqueue_script( ‘pol’ );
wp_register_script( ‘fun’, get_bloginfo(‘wpurl’) . «/wp-content/plugins/infograph/src/plugins/jqplot.funnelRenderer.js»);
wp_enqueue_script( ‘fun’ );
wp_register_script( ‘pie’, get_bloginfo(‘wpurl’) . «/wp-content/plugins/infograph/src/plugins/jqplot.pieRenderer.js»);
wp_enqueue_script( ‘pie’ );
wp_register_script( ‘meg’, get_bloginfo(‘wpurl’) . «/wp-content/plugins/infograph/src/plugins/jqplot.meterGaugeRenderer.js»);
wp_enqueue_script( ‘meg’ );
}
function add_css () {
echo ‘
<link type=»text/css» rel=»stylesheet» href=»‘ . get_bloginfo(‘wpurl’) . ‘/wp-content/plugins/infograph/src/jquery.jqplot.css» />’ ;
echo ‘<link type=»text/css» rel=»stylesheet» href=»‘ . get_bloginfo(‘wpurl’) . ‘/wp-content/plugins/infograph/examples.css» />’ ;
}
add_action(‘wp_enqueue_scripts’, ‘myscripts’);
add_action(‘wp_head’, ‘add_css’);
|
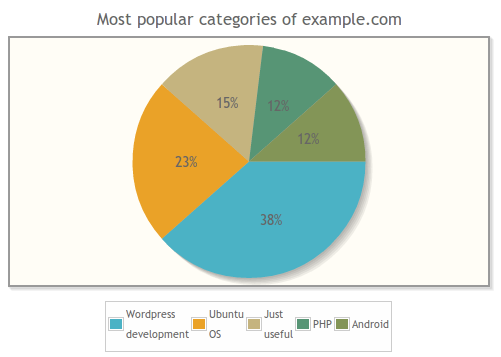
Шаг 2 «Популярные категории» Диаграмма:
Этот график представляет собой круговую диаграмму, которая показывает наиболее популярные категории вашего блога. Вы можете разместить его на любой странице или посте. Просто добавьте шорткод [mycategories] в любой пост:
|
01
02
03
04
05
06
07
08
09
10
11
12
13
14
15
16
17
18
19
20
21
22
23
24
25
26
27
28
29
30
|
function categories($atts,$content = ») {
$ch_cats = get_categories(array(‘orderby’=>’count’,’order’=>’desc’) );
$sayy= count($ch_cats);
$chl=»;
for ($i=1;$i<=5;$i++)
{
$chl=$chl.'[\».$ch_cats[$i-1]->name.’\’,’.$ch_cats[$i-1]->count.’],’;
}
$chl='[[‘.substr($chl,0,-1).’]]’;
return ‘<script>
$(document).ready(function(){
plot1 = $.jqplot(\’chart1\’, ‘.$chl.’, {
title: \’Most popular categories of example.com\’,
seriesDefaults:{renderer:$.jqplot.PieRenderer,rendererOptions: { padding: 8, showDataLabels: true}},legend:{show:true,placement: \’outside\’,rendererOptions: {numberRows: 1}},
legend:{show:true,
placement: \’outside\’,
rendererOptions: {
numberRows: 1
},
location:\’s\’,
marginTop: \’15px\’
}
});
});
</script>
<div id=»chart1″ style=»margin-top:30px;margin-bottom:30px; margin-left:20px; width:500px; height:300px;»></div> ‘;
}
add_shortcode(‘mycategories’, ‘categories’);
|
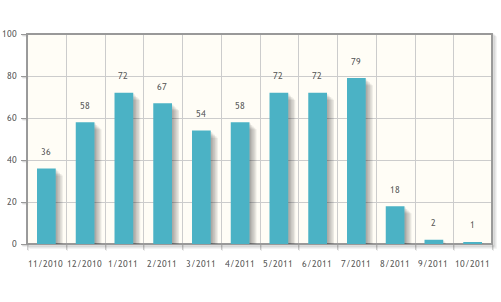
Шаг 3 Диаграмма «Активность по месяцам»:
Этот график может отображать активность за последние 12 месяцев в вашем блоге. Он показывает, сколько сообщений вы опубликовали за последние 12 месяцев в месяц.
|
01
02
03
04
05
06
07
08
09
10
11
12
13
14
15
16
17
18
19
20
21
22
23
24
25
26
27
28
29
30
31
32
33
34
35
36
37
38
39
40
|
function postsbymonth($atts,$content = ») {
// Post count by month
global $wpdb,$wp_query;
$postcountbymonth=$wpdb->get_results(«select * from (select MONTH(post_date) as mo,YEAR(post_date) as ye,count(ID) as co from $wpdb->posts
where post_status=’publish’
group by MONTH(post_date),YEAR(post_date) order by post_date desc limit 12) a order by ye asc,mo asc»);
$labels=»;$postcounts=»;
foreach ($postcountbymonth as $pc)
{
$labels=$labels.’\’ ‘.$pc->mo.’/’.$pc->ye.’
$postcounts=$postcounts.$pc->co.’,’;
}
$postcounts='[‘.substr($postcounts,0,-1).’]’;
$labels='[‘.substr($labels,0,-1).’]’;
return ‘
<script language=»javascript» type=»text/javascript»>
$(document).ready(function(){
$.jqplot.config.enablePlugins = true;
var s1 = ‘.$postcounts.’;
var ticks = ‘.$labels.’;
plot1 = $.jqplot(\’chart2\’, [s1], {
seriesDefaults:{
renderer:$.jqplot.BarRenderer,
pointLabels: { show: true }
},
axes: {
xaxis: {
renderer: $.jqplot.CategoryAxisRenderer,
ticks: ticks
}
},
highlighter: { show: false }
});
});
</script>
<div id=»chart2″ style=»margin-top:20px;margin-bottom:20px; margin-left:20px; width:500px; height:250px;»></div>
‘;
}
add_shortcode(‘bymonth’, ‘postsbymonth’);
|
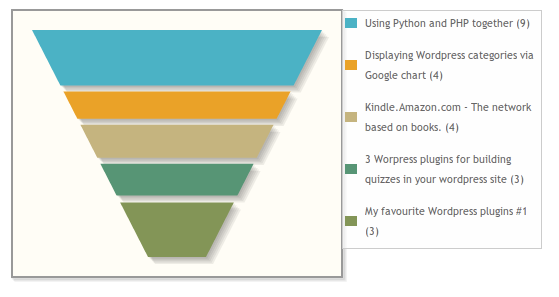
Шаг 4 Диаграмма «Самые комментируемые сообщения»:
Третий график также об интересных данных, он показывает ваши самые комментируемые посты.
|
01
02
03
04
05
06
07
08
09
10
11
12
13
14
15
16
17
18
19
20
21
22
23
24
25
26
27
28
29
30
31
32
33
34
35
36
37
|
function mostcommented($atts,$content = ») {
global $wpdb,$wp_query;
$postcountbymonth=$wpdb->get_results(«select post_title as pt,comment_count as co from $wpdb->posts where post_status=’publish’ order by co desc limit 5»);
$labels=»;$titles=»;
foreach ($postcountbymonth as $pc)
{
$titles=$titles.'[\’ ‘.$pc->pt.’
}
$titles='[‘.substr($titles,0,-1).’]’;
return ‘
<style>.jqplot-table-legend{width:200px}
#chart4 table tr td:nth-child(odd){width:20px;}
</style>
<script type=»text/javascript»>
$(document).ready(function(){
s1 = ‘.$titles.’;
plot4 = $.jqplot(\’chart4\’, [s1], {
seriesDefaults:{
renderer:$.jqplot.FunnelRenderer,
rendererOptions: {
showDataLabels: false
}
},
legend: {
show: true,
placement: \’outside\’
}
});
});
</script>
<div id=»chart4″ style=»margin-top:20px;margin-bottom:20px; margin-left:20px; width:350px; height:300px;»></div>
‘;
}
add_shortcode(‘mypopularposts’, ‘mostcommented’);
|
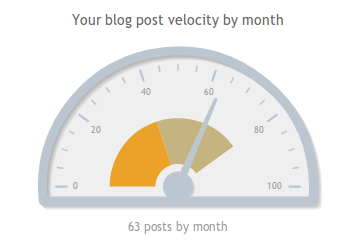
Шаг 5 Диаграмма «Скорость блога»:
Наш последний график для этого урока показывает скорость вашего блога. Показывает среднее количество ваших постов по месяцам.
|
01
02
03
04
05
06
07
08
09
10
11
12
13
14
15
16
17
18
19
20
21
22
23
24
25
26
27
28
29
30
31
32
33
34
35
36
37
38
39
40
41
42
43
|
function velocity($atts,$content = ») {
global $wpdb,$wp_query;
$postcountbymonth=$wpdb->get_results(«select post_title as pt,comment_count as co from $wpdb->posts where post_status=’publish'»);
$postcountresult= round($wpdb->num_rows/12);
$maxvel=pow(10,strlen((string)$postcountresult));
$ticks=»;
$intervals=»;
for ($i=1;$i<=6;$i++){
$ticks=$ticks.($maxvel*($i-1)/5).’,’;
if($i % 2 != 0)
{
$intervals=$intervals.($maxvel*($i-1)/5).’,’;
}
}
$ticks='[‘.substr($ticks,0,-1).’]’;
$intervals='[‘.substr($intervals,0,-1).’]’;
return ‘
<script>
$(document).ready(function(){
s1 = [‘.$postcountresult.’];
plot5 = $.jqplot(\’chart5\’,[s1],{
title: \’Your blog post velocity by month\’,
series: [{
renderer: $.jqplot.MeterGaugeRenderer,
rendererOptions: {
label: \’Blog velocity\’,
labelPosition: \’bottom\’,
ticks: ‘.$ticks.’,
intervals:’.$intervals.’,
}
}],
});
});
</script>
<div id=»chart5″ style=»margin-top:20px;margin-bottom:20px; margin-left:20px; width:350px; height:300px;»></div>’;
}
add_shortcode(‘velocity’, ‘velocity’);
|
Используя графики WordPress API и jQuery, вы можете расширить этот список графиков, эти 4 графика были просто примерами для заинтересованных разработчиков.