«Нет нет! Сначала приключения, — сказал грифон нетерпеливым тоном, — объяснения требуют такого ужасного времени.
— Льюис Кэрролл — Приключения Алисы в стране чудес
Часто довольно просто представить преимущества использования Titan . Разработка сложной аналитики графов на многомиллиардном граничном распределенном графе представляет собой приключения, которые ждут вас. Как и Грифон из рассказа Льюиса Кэрролла, желание сразу погрузиться в приключения может быть довольно сильным. К сожалению и совершенно очевидно, что преимущества Титана не могут быть реализованы, пока в нем нет данных. Рассмотрим объяснения, которые следуют; Это стратегии, с помощью которых данные загружаются в Titan, что позволяет им совершать приключения .
 Существует ряд различных переменных, которые могут влиять на подход к загрузке данных в график, но атрибут, который обеспечивает лучшее руководство при принятии решения, — это размер. Для целей данной статьи «размер» относится к предполагаемому количеству ребер, загружаемых в график. Стратегия, используемая для загрузки данных, имеет тенденцию меняться в степени десяти , где стратегия для загрузки 1 миллиона ребер отличается от подхода для 10 миллионов ребер.
Учитывая этот аккуратный и запоминающийся способ классификации стратегий пакетной загрузки, эта статья, состоящая из двух частей, обрисовывает в общих чертах каждую стратегию, начинающуюся с наименьшего с 1 миллиона ребер или менее и продолжающуюся от десяти до 1 миллиарда и более. Эта первая часть будет посвящена 1 миллиону и 10 миллионам ребер, что обычно включает в себя обычные операции Gremlin . Вторая часть будет посвящена 100 миллионам и одному миллиарду граней, что обычно связано с использованием Фаунуса .
1 миллион
 В диапазоне миллионов ребер или меньше не существует особой стратегии загрузки, поскольку график, вероятно, поместится в памяти, а время загрузки будет достаточно быстрым. Ошибки в этом масштабе не так дороги, потому что проблемы, как правило, легко диагностировать, и график может быть перезагружен с нуля без больших затрат времени.
Как объяснялось в предыдущем сообщении в блоге, озаглавленном Постоянство и запросы Polyglot с Gremlin , Gremlin REPL — это гибкая среда для работы с любыми данными. Очевидно, что он обеспечивает доступ к графическим базам данных, таким как Titan, но в рамках одного и того же сеанса REPL можно также подключаться к реляционной базе данных, обращаться к веб-службе, читать файл и т. Д. Учитывая эту возможность, написание сценария Gremlin это может быть выполнено через REPL, вероятно, самый легкий и прямой способ получить данные в граф.
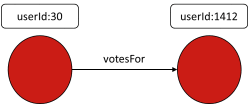 Сеть голосования Википедии — это набор данных, который «содержит все данные голосования в Википедии с момента создания Википедии до января 2008 года. Вершины в сети представляют пользователей Википедии, а направленный край от вершины i до вершины j представляет того пользователя, которого я проголосовал за пользователя j». «. В рамках своей базовой структуры данных с разделителями табуляции она содержит 7 115 вершин и 103 689 ребер, что делает ее хорошим размером для этой демонстрации.
Все примеры в этом посте предполагают, что последняя версия Titan загружена и распакована ( для примеров требуется упаковка titan-all ). Из корневого каталога Titan загрузите и распакуйте набор данных Wikipedia Vote Network:
$ curl -L -O http://snap.stanford.edu/data/wiki-Vote.txt.gz
$ gunzip wiki-Vote.txt.gz
Распаковка архива создаст wiki-Vote.txtфайл в корне каталога Titan. Следующий скрипт Gremlin демонстрирует, как загрузить этот файл в Titan (при поддержке BerkleyDB ):
g = TitanFactory.open('/tmp/1m')
g.makeKey('userId').dataType(String.class).indexed(Vertex.class).unique().make()
g.makeLabel('votesFor').make()
g.commit()
getOrCreate = { id ->
defp = g.V('userId', id)
if(p.hasNext()) ? p.next() : g.addVertex([userId:id])
}
newFile('wiki-Vote.txt').eachLine{
if(!it.startsWith("#")){
(fromVertex, toVertex) = it.split('\t').collect(getOrCreate)
fromVertex.addEdge('votesFor', toVertex)
}
}
g.commit()
Основные части скрипта загрузки данных, на которые следует обратить внимание:
g.makeKey(‘userId’)…— Сначала создайте типы в Titan. В этом случае схема состоит только из a,userIdкоторый будет в каждой пользовательской вершине. Всегда фиксируйте в конце создания типа и перед загрузкой данных в экземпляр графа.getOrCreate = { id ->...— Вспомогательная функция, которая принимает идентификатор вершины (т. Е. UserId) в качестве аргумента и выполняет поиск индекса, чтобы определить, существует ли уже вершина. Если она существует, вершина возвращается, но если она не существует, она создается. КонцепцияgetOrCreateявляется распространенной, и наличие эффективной вспомогательной функции для выполнения этой задачи почти всегда будет необходимо.new File('wiki-Vote.txt').eachLine {— Читайте файл данных источника построчно, выполняя предоставленное замыкание для каждого.if (!it.startsWith("#")){— Файл содержит комментарии, которые обозначены # в начале строки. Эти строки следует игнорировать.(fromVertex, toVertex) = it.split('\t').collect(getOrCreate)— Каждая строка состоит из пары значений с разделителями табуляции. Этот код разбивает строку текста на вкладке, чтобы создать список, содержащий дваuserIdзначения.getOrCreateФункция применяется по тем значениям сcollectи полученным списком затем деструктурированная в две переменных , содержащих вершины в графе , которые либо уже существовали или были в противном случае вновь созданная:fromVertexиtoVertex.fromVertex.addEdge('votesFor', toVertex)— Строит ребро между двумя вершинами.g.commit()— Стоит отметить, что эта загрузка выполняется в контексте одной транзакции . На верхнем крае пограничного диапазона в 1 миллион необходимо будет выполнить промежуточные коммиты во время этого процесса.
To execute this script, copy it into a file called load-1m.groovy at the root of the Titan install directory. Please note that the script will generate the Titan database on the file system at /tmp/1m. Start Gremlin with bin/gremlin.sh. When the REPL has initialized execute the script as follows:
$ bin/gremlin.sh
\,,,/
(o o)
-----oOOo-(_)-oOOo-----
gremlin> \. load-1m.groovy
==>titangraph[local:/tmp/1m]
==>userId
...
==>null
gremlin> g.V.count()
==>7115
gremlin> g.E.count()
==>103689
The Wikipedia Vote Network has a simple schema. Even at the scale of 1 million edges, the complexity of a batch loading script can only rise from this case. The loading script in this section provides for a good skeleton on which more complicated loads can be fleshed out.
10 Million
 The approach to loading tens of millions of edges isn’t so different from the previous section. A Gremlin script is still the most direct approach to loading, however there are some differences to consider. The most important of these differences is the use of
 BatchGraph, which handles intermediate commits of transactions at specified intervals and maintains a vertex cache for fast retrieval. Please refer to the BatchGraphdocumentation for important information on the limitations of its usage.
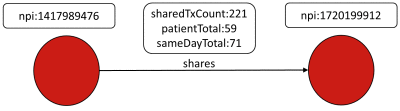
The DocGraph data set “shows how healthcare providers team to provide care”. Vertices in this network represent healthcare providers, where they are identified by an NPI number. Edges represent shared interactions between two providers with three properties that further qualify that interaction. The data is partitioned into several sizes based on time windows. This section will utilize the “30-day Window”, which consists of approximately 1 million vertices and 73 million edges.
From Titan’s root directory download and unpackage the DocGraph data set:
$ curl -L -O http://bit.ly/DocGraph2012-2013-Days30zip
$ unzip DocGraph2012-2013-Days30zip && rm DocGraph2012-2013-Days30zip
$ head -n3 DocGraph-2012-2013-Days30.csv
$ sort DocGraph-2012-2013-Days30.csv > DocGraph-2012-2013-Days30-sorted.csv
Unzipping the archive will create the DocGraph-2012-2013-Days30.csv file in the root of Titan directory. Unlike the case in the previous section, the data is pre-sorted by the NPI number of what will be the out vertex for each edge. Pre-sorting the data will help improve the performance of BatchGraph, as writes to and flushes of the cache are reduced. The following Gremlin script demonstrates how to load that file into Titan (backed by BerkleyDB):
conf = newBaseConfiguration() {{
setProperty("storage.backend", "berkeleyje")
setProperty("storage.directory", "/tmp/10m")
setProperty("storage.batch-loading", true)
}}
g = TitanFactory.open(conf)
g.makeKey("npi").dataType(String.class).single().unique().indexed(Vertex.class).make()
sharedTransactionCount = g.makeKey("sharedTxCount").dataType(Integer.class).make()
patientTotal = g.makeKey("patientTotal").dataType(Integer.class).make()
sameDayTotal = g.makeKey("sameDayTotal").dataType(Integer.class).make()
g.makeLabel("shares").signature(sharedTransactionCount, patientTotal, sameDayTotal).make()
g.commit()
bg = newBatchGraph(g, VertexIDType.STRING, 10000)
bg.setVertexIdKey("npi")
c = 0L
newFile("DocGraph-2012-2013-Days30-sorted.csv").eachLine({ final String line ->
def(id1,
id2,
sharedTransactionCount,
patientTotal,
sameDayTotal) = line.split(',')*.trim()
defv1 = bg.getVertex(id1) ?: bg.addVertex(id1)
defv2 = bg.getVertex(id2) ?: bg.addVertex(id2)
defedge = bg.addEdge(null, v1, v2, "shares")
edge.setProperty("sharedTxCount", sharedTransactionCount asInteger)
edge.setProperty("patientTotal", patientTotal asInteger)
edge.setProperty("sameDayTotal", sameDayTotal asInteger)
if(++c%100000L == 0L) println"Processed ${c} edges"
})
bg.commit()
The anatomy of this script is as follows (it can be executed in the Gremlin REPL with the instructions supplied in the previous section):
setProperty("storage.batch-loading", true)– Enabling “batch loading” for Titan will help improve performance by disabling consistency checks and locking. Read more about this option and other settings that can affect batch loading in the Titan documentation.g.makeKey("npi")...– As in the previous example at the 1 million edge scale, types should be created and committed first.bg = new BatchGraph(g, VertexIDType.STRING, 10000)– Wrap theTitanGraphinstance in aBatchGraph, define the data type of the identifier which in this case for the NPI number is aSTRING, and set the transaction size to10000. With this setting,BatchGraphwill automatically commit transactions on every 10,000 mutations to the graph.bg.setVertexIdKey("npi")– TellsBatchGraphthat the vertex identifier will be stored in a vertex property key callednpi....sameDayTotal) = line.split(',')*.trim()– Each line in the file consists of a pair of comma delimited values. This line splits the line of text on the comma to create a list containing five values destructured to five variables.def v1 = bg.getVertex(id1) ?: bg.addVertex(id1)–BatchGraphhelps simplify thegetOrCreatefunction from the previous section.BatchGraphoverrides the default functionality ofaddVertexandgetVertexallowing a specification and look-up of a vertex by the NPI number. If the vertex is not found,getVertexwill returnnulland the vertex will have to be added.bg.commit()– With all loading complete, make a final call tocommitto finalize any remaining elements in the transaction buffer.
![]() The DocGraph example demonstrated the key strategies for loading tens of millions of edges, which in summary are: pre-process data when possible to ease loading and improve performance and use
The DocGraph example demonstrated the key strategies for loading tens of millions of edges, which in summary are: pre-process data when possible to ease loading and improve performance and use BatchGraph to allow focus on the data being loaded as opposed to loading mechanics, such as manually batching commits, handling identifiers, and writing getOrCreate methods.
Some other strategies and ideas to consider at this scale include:
- Do programming and testing of load scripts with a subset of the data to improve development cycle time.
- Use third-party libraries to to be more productive and reduce the amount of code to be written (e.g. groovycsv).
- Consider methods of parallel loading using gpars, if the data is such that it can be organized to allow for that.
- If there is an inclination to load data from a non-JVM language, like Python, reconsider this article and write the load script in Gremlin. In this way, the process of loading data can be completed quickly, allowing focus on language-specific tooling (e.g. Bulbs) for Python application development).
The tens of millions size falls into the realm of “Boutique Graph Data“, where many applications will fit or at least be where most applications will start. In that sense, this size is perhaps one of the more relevant sizes in the “Powers of Ten.”
Conclusion
This article explored the lower scales of loading data to Titan. At the millions and tens of millions of edges scales, a Gremlin script and the REPL is generally all that is required for batch-loading activities. For those just getting started with TinkerPop and Titan, taking this approach means having to learn the least amount of the stack in order to get started. Being comfortable at this scale of loading is critical to being successful at the hundreds of millions and billions of edges scales to be described in the next part of this article series.
Acknowledgments
Dr. Vadas Gintautas originally foresaw the need to better document bulk loading strategies and that such strategies seemed to divide themselves nicely in powers of ten.
This post was originally written by Stephen Mallette and Daniel Kuppitz for Aurelius.