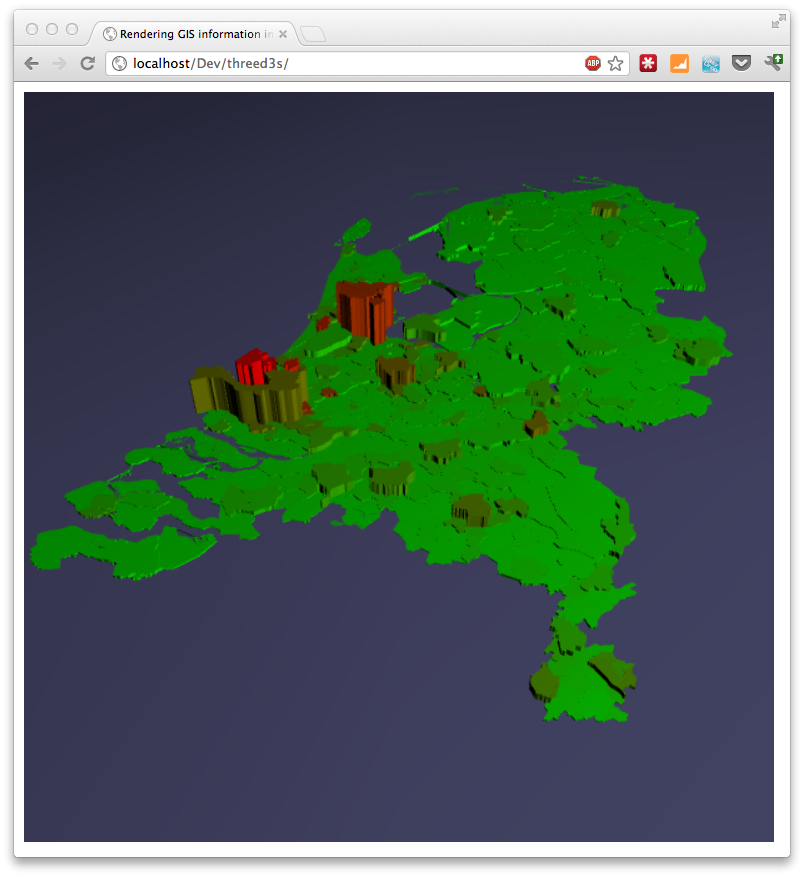
Последние пару дней я играл с three.js и геоинформацией. Я хотел иметь возможность отображать данные карты / гео (например, в формате geojson) внутри сцены three.js. Таким образом, у меня есть другое измерение, которое я мог бы использовать, чтобы показать конкретную метрику, а не просто использовать цвет на 2D-карте. В этой статье я покажу вам, как вы можете это сделать. В примере, который мы создадим, показана трехмерная карта Нидерландов, созданная в Three.js, в которой используется цвет для обозначения плотности населения на муниципалитет, а высота каждого муниципалитета представляет фактическое количество жителей.
Или, если вы можете посмотреть на рабочий пример .
Эта информация основана на открытых данных, доступных от правительства Нидерландов. Если вы посмотрите на источник из примера, вы увидите json, который мы используем для этого. Для получения дополнительной информации о geojson и о том, как его анализировать, см. Другие статьи, которые я сделал на эту тему:
- Использование d3.js для визуализации ГИС
- Участок выборов, часть 1: основы с Knockout.js, Bootstrap и d3.js
Чтобы это работало, мы предпримем следующие шаги:
- Загрузить входные геоданные
- Настройте сцену three.js
- Преобразуйте входные данные в путь Three.js, используя d3.js
- Установите цвет и высоту объекта Three.js
- Сделать все
Просто напоминание о том, что все работает, просто посмотрите на пример .
Загрузить входные геоданные
D3.js has support to load json and directly transform it to an SVG path. Though this is a convenient way, I only needed the path data, not the complete SVG elements. So to load json I just used jquery’s json support.
// get the data
    jQuery.getJSON('data/cities.json', function(data, textStatus, jqXHR) {
    ..
   });
This will load the data and pass it in the data object to the supplied function.
Setup a three.js scene
Before we do anything with the data lets first setup a basic Three.js scene.
// Set up the three.js scene. This is the most basic setup without
        // any special stuff
        function initScene() {
            // set the scene size
            var WIDTH = 600, HEIGHT = 600;

            // set some camera attributes
            var VIEW_ANGLE = 45, ASPECT = WIDTH / HEIGHT, NEAR = 0.1, FAR = 10000;

            // create a WebGL renderer, camera, and a scene
            renderer = new THREE.WebGLRenderer({antialias:true});
            camera = new THREE.PerspectiveCamera(VIEW_ANGLE, ASPECT,
                                                  NEAR, FAR);
            scene = new THREE.Scene();

            // add and position the camera at a fixed position
            scene.add(camera);
            camera.position.z = 550;
            camera.position.x = 0;
            camera.position.y = 550;
            camera.lookAt( scene.position );

            // start the renderer, and black background
            renderer.setSize(WIDTH, HEIGHT);
            renderer.setClearColor(0x000);

            // add the render target to the page
            $("#chart").append(renderer.domElement);

            // add a light at a specific position
            var pointLight = new THREE.PointLight(0xFFFFFF);
            scene.add(pointLight);
            pointLight.position.x = 800;
            pointLight.position.y = 800;
            pointLight.position.z = 800;

            // add a base plane on which we'll render our map
            var planeGeo = new THREE.PlaneGeometry(10000, 10000, 10, 10);
            var planeMat = new THREE.MeshLambertMaterial({color: 0x666699});
            var plane = new THREE.Mesh(planeGeo, planeMat);

            // rotate it to correct position
            plane.rotation.x = -Math.PI/2;
            scene.add(plane);
        }
Nothing to special, the comments inline should nicely explain what we’re doing here. Next it gets more interesting.
Convert the input data to a Three.js path using d3.js
What we need to do next is convert our geojson input format to a THREE.Path that we can use in our scene. Three.js itself doesn’t support geojson or SVG for that matter. Luckily though someone already started work on integrating d3.js with three.js. This project is called «d3-threeD» (sources can be found on github here). With this extension you can automagically render SVG elements in 3D directly from D3.js. Cool stuff, but it didn’t allow me any control over how the elements were rendered. It does however contain a function we can use for our scenario. If you look through the source code of this project you’ll find a method called «transformSVGPath». This method converts an SVG path string to a Three.Shape element. Unfortunately this method isn’t exposed, but that’s quickly solved by adding this to the d3-threeD.js file:
// at the top
var transformSVGPathExposed;
...
// within the d3threeD(exports) function
transformSVGPathExposed = transformSVGPath;
</javscript>

This way we can call this method separately. Now that we have a way to transform an SVG path to a Three.js shape, we only need to convert the geojson to an SVG string and pass it to this function. We can use the geo functionaly from D3.js for this:

<javascript>
geons.geoConfig = function() {
    this.TRANSLATE_0 = appConstants.TRANSLATE_0;
    this.TRANSLATE_1 = appConstants.TRANSLATE_1;
    this.SCALE = appConstants.SCALE;

    this.mercator = d3.geo.mercator();
    this.path = d3.geo.path().projection(this.mercator);

    this.setupGeo = function() {
        var translate = this.mercator.translate();
        translate[0] = this.TRANSLATE_0;
        translate[1] = this.TRANSLATE_1;

        this.mercator.translate(translate);
        this.mercator.scale(this.SCALE);
    }
}
The path variable from the previous piece of code can now be used like this:
var feature = geo.path(geoFeature);
To convert a geojson element to an SVG path. So how does this look combined?
// add the loaded gis object (in geojson format) to the map
      function addGeoObject() {
          // keep track of rendered objects
          var meshes = [];
          ...

         // convert to mesh and calculate values
          for (var i = 0 ; i < data.features.length ; i++) {
              var geoFeature = data.features[i]
              var feature = geo.path(geoFeature);
              // we only need to convert it to a three.js path
              var mesh = transformSVGPathExposed(feature);
              // add to array
              meshes.push(mesh);

             ...
      }
As you can see we iterate over the data.features list (this contains all the geojson representations of the municipalities). Each municipality is converted to an svg string, and each svg string is converted to a mesh. This mesh is a Three.js object that we can render on the scene.
Set the color and height of the Three.js object
Now we just need to set the height and the color of the Three.js shape and add it to the scene. The extended addGeoObject method now looks like this:
     // add the loaded gis object (in geojson format) to the map
      function addGeoObject() {
          // keep track of rendered objects
          var meshes = [];
          var averageValues = [];
          var totalValues = [];


          // keep track of min and max, used to color the objects
          var maxValueAverage = 0;
          var minValueAverage = -1;

          // keep track of max and min of total value
          var maxValueTotal = 0;
          var minValueTotal = -1;

          // convert to mesh and calculate values
          for (var i = 0 ; i < data.features.length ; i++) {
              var geoFeature = data.features[i]
              var feature = geo.path(geoFeature);
              // we only need to convert it to a three.js path
              var mesh = transformSVGPathExposed(feature);
              // add to array
              meshes.push(mesh);

              // we get a property from the json object and use it
              // to determine the color later on
              var value = parseInt(geoFeature.properties.bev_dichth);
              if (value > maxValueAverage) maxValueAverage = value;
              if (value < minValueAverage || minValueAverage == -1) minValueAverage = value;
              averageValues.push(value);

              // and we get the max values to determine height later on.
              value = parseInt(geoFeature.properties.aant_inw);
              if (value > maxValueTotal) maxValueTotal = value;
              if (value < minValueTotal || minValueTotal == -1) minValueTotal = value;

              totalValues.push(value);
          }

          // we've got our paths now extrude them to a height and add a color
          for (var i = 0 ; i < averageValues.length ; i++) {

              // create material color based on average
              var scale = ((averageValues[i] - minValueAverage) / (maxValueAverage - minValueAverage)) * 255;
              var mathColor = gradient(Math.round(scale),255);
              var material = new THREE.MeshLambertMaterial({
                  color: mathColor
              });

              // create extrude based on total
              var extrude = ((totalValues[i] - minValueTotal) / (maxValueTotal - minValueTotal)) * 100;
              var shape3d = meshes[i].extrude({amount: Math.round(extrude), bevelEnabled: false});

              // create a mesh based on material and extruded shape
              var toAdd = new THREE.Mesh(shape3d, material);

              // rotate and position the elements nicely in the center
              toAdd.rotation.x = Math.PI/2;
              toAdd.translateX(-490);
              toAdd.translateZ(50);
              toAdd.translateY(extrude/2);

              // add to scene
              scene.add(toAdd);
          }
      }

        // simple gradient function
        function gradient(length, maxLength) {

            var i = (length * 255 / maxLength);
            var r = i;
            var g = 255-(i);
            var b = 0;

            var rgb = b | (g << 8) | (r << 16);
            return rgb;
        }
A big piece of code, but not that complex. What we do here is we keep track of two values for each municipality: the population density and the total population. These values are used to respectively calculate the color (using the gradient function) and the height. The height is used in the Three.js extrude function which converts our 2D Three.Js path to a 3D shape. The color is used to define a material. This shape and material is used to create the Mesh that we add to the scene.
Render everything
All that is left is to render everything. For this example we’re not interested in animations or anything so we can make a single call to the renderer:
renderer.render( scene, camera );
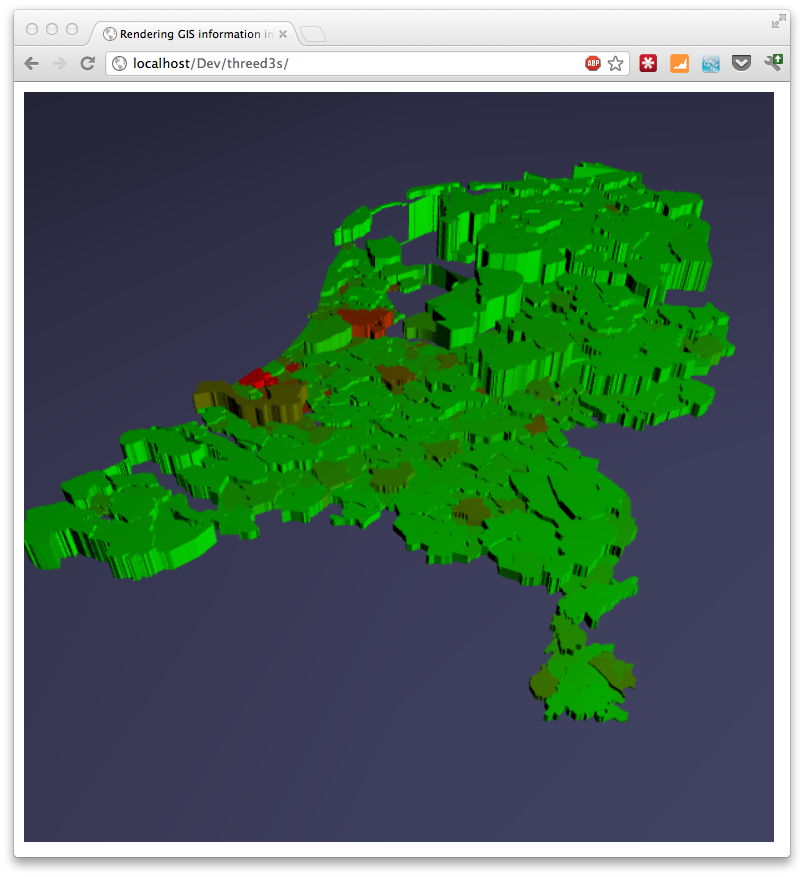
And the result is as you saw in the beginning. The following image shows a different example. This time we once again show the population density, but now the height represents the land area of the municipality.
I’m currently creating a new set of geojson data, but this time for the whole of Europe. So in the next couple of weeks expect some articles using maps of Europe.