На прошлой неделе я провел несколько часов в погоне за утечкой невыгружаемого пула, вызванной простым приложением Win32. После некоторой работы «разделяй и властвуй» мы смогли точно определить строку кода, вызывающую утечку — на первый взгляд невинный вызов WSARecv, который выполняет асинхронный прием сокетов. Как приложение пользовательского режима может вызвать утечку невыгружаемого пула, которая быстро накапливается в десятки мегабайт памяти ядра? Читайте дальше для деталей.
Если вы хотите повторить эту проблему самостоятельно и поэкспериментировать с процессом диагностики, описанным ниже, используйте следующую суть . Это 54 строки кода, включая обработку ошибок и #includes.
Захват стеков распределения пула
Все началось с сообщения о том, что рассматриваемый процесс истощает системные ресурсы. Операционная группа использовала диспетчер задач Windows, чтобы определить, что в процессе происходит утечка невыгружаемого пула с тревожной скоростью в несколько десятков КБ в секунду при высокой нагрузке. Вооружившись относительно простым воспроизведением, я начал исследовать утечку с помощью ETW. Поставщик ядра ETW может сообщать о выделениях пула, которые не освобождаются, и стеке вызовов, который вызывает эти выделения.
Я запустил следующую команду для захвата распределений пулов со стеками вызовов
xperf -on PROC_THREAD+LOADER+POOL -stackwalk PoolAlloc
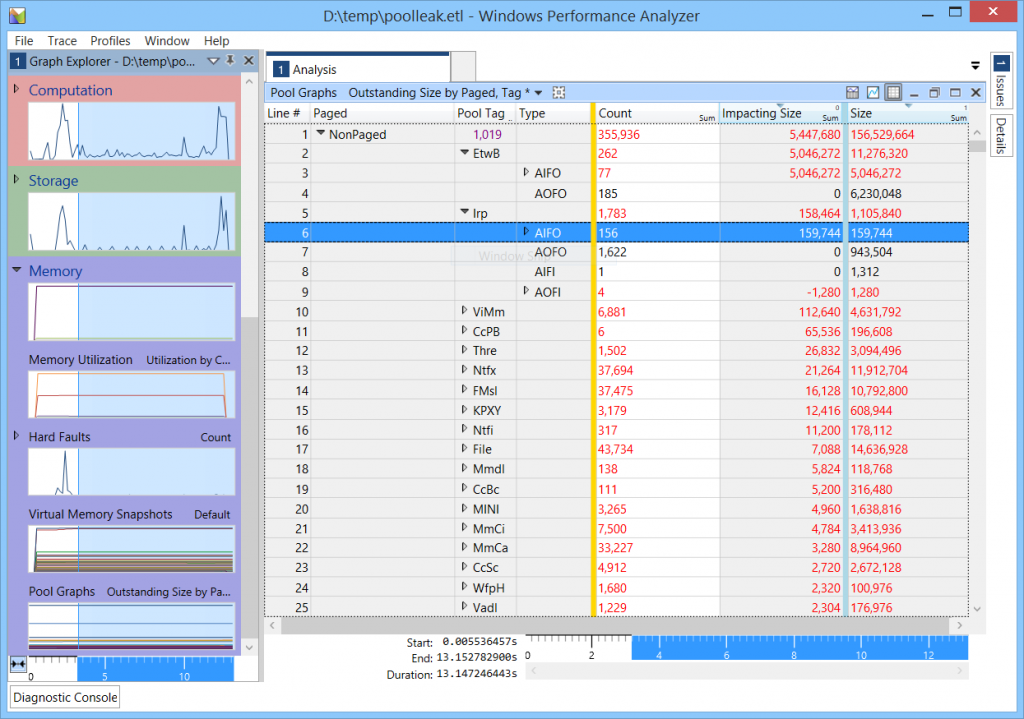
And then analyzed the resulting report in Windows Performance Analyzer. Specifically, we were able to determine that the Irp pool tag is responsible for the majority of the leak (the following screenshot shows that we leaked 159,744 bytes in 156 allocations over a timespan of just over 10 seconds). The Irp tag represents IRPs, I/O Request Packets, which are data structures allocated by the I/O manager whenever an I/O operation begins.
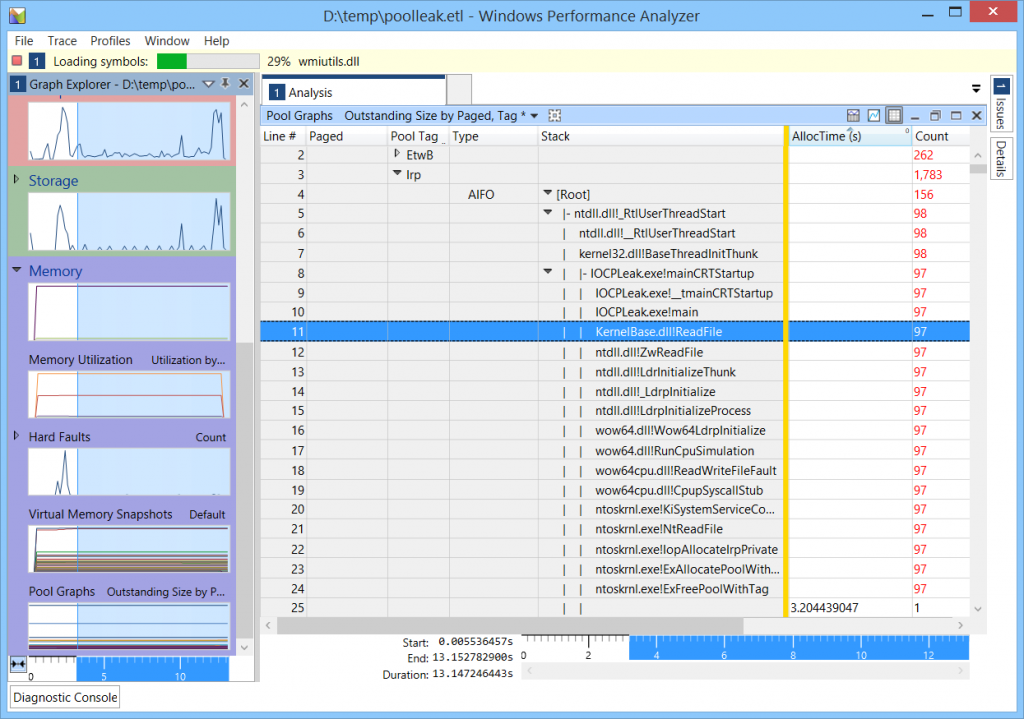
Looking at the allocating call stacks, we were able to determine that all the suspicious Irp tag allocations originated at the same call stack. In the following screenshot, the call stack originates at a ReadFile call; in the original application, it was a WSARecv call. Note the transition from the 32-bit stack (KernelBase!ReadFile, ntdll!ZwReadFile) to the 64-bit stack (ntdll!LdrInitializeThunk, … wow64cpu!CpupSyscallStub) and finally to the kernel stack (ntoskrnl!NtReadFile).
At this point, I was a bit baffled. The code in question was doing essentially the following, in a tight loop:
OVERLAPPED overlapped = { 0 };
overlapped.hEvent = CreateEvent(nullptr, TRUE, FALSE, nullptr);

char buffer[10];
ReadFile(file, buffer, sizeof(buffer), nullptr, &overlapped);

// Do some other work in the meantime, and then:

WaitForSingleObject(overlapped.hEvent, INFINITE;
DWORD bytesRead;
GetOverlappedResult(file, &overlapped, &bytesRead, TRUE);

CloseHandle(overlapped.hEvent);
Each I/O operation clearly has a chance to complete before the next operation is scheduled. There seems to be no reason for the IRPs to be queued up indefinitely. I wanted to verify that the IRPs were indeed related to the operation in question, and that they were indeed completed, so I fired up a kernel debugger (LiveKD in this case).
Looking for IRPs in the Kernel Debugger
The kernel debugger has a handy command, !irpfind, which can display all IRP structures found in the non-paged pool. Most of the IRPs I saw were completed and associated with the same thread, looking like this (the second column is the ETHREAD address associated with the IRP):
ffffe00008b0fc10 [ffffe00001665080] Irp is complete (CurrentLocation 12 > StackCount 10)
ffffe00008b11150 [ffffe00001665080] Irp is complete (CurrentLocation 12 > StackCount 10)
ffffe00008b192f0 [ffffe00001665080] Irp is complete (CurrentLocation 12 > StackCount 10)
ffffe00008b1b400 [ffffe00001665080] Irp is complete (CurrentLocation 12 > StackCount 10)
ffffe00008b1bc10 [ffffe00001665080] Irp is complete (CurrentLocation 12 > StackCount 10)
ffffe00008b3b4a0 [ffffe00001665080] Irp is complete (CurrentLocation 12 > StackCount 10)
ffffe00008b4c010 [ffffe00001665080] Irp is complete (CurrentLocation 12 > StackCount 10)
ffffe00008b4cc10 [ffffe00001665080] Irp is complete (CurrentLocation 12 > StackCount 10)
The next question, then, is why would completed IRPs never be freed? To answer this question, I had to look at the IRP objects in more detail. Here’s one representative:
0: kd> dt -r nt!_IRP ffffe00008b192f0
   +0x000 Type             : 0n6
   +0x002 Size             : 0x3e8
   +0x004 AllocationProcessorNumber : 2
   +0x006 Reserved         : 0
   +0x008 MdlAddress       : (null)
   +0x010 Flags            : 0x60900
   +0x018 AssociatedIrp    : <unnamed-tag>
   +0x020 ThreadListEntry  : _LIST_ENTRY [ 0xffffe000`08b19310 - 0xffffe000`08b19310 ]
   +0x030 IoStatus         : _IO_STATUS_BLOCK
   +0x040 RequestorMode    : 1 ''
   +0x041 PendingReturned  : 0x1 ''
   +0x042 StackCount       : 10 ''
   +0x043 CurrentLocation  : 12 ''
   +0x044 Cancel           : 0 ''
   +0x045 CancelIrql       : 0 ''
   +0x046 ApcEnvironment   : 0 ''
   +0x047 AllocationFlags  : 0x15 ''
   +0x048 UserIosb         : 0x00000000`003efd14 _IO_STATUS_BLOCK
   +0x050 UserEvent        : 0xffffe000`06648470 _KEVENT
   +0x058 Overlay          : <unnamed-tag>
   +0x068 CancelRoutine    : (null)
   +0x070 UserBuffer       : 0x00000000`003efd00 Void
 +0x078 Tail : <unnamed-tag>
 +0x000 Overlay : <unnamed-tag>
         +0x000 DeviceQueueEntry : _KDEVICE_QUEUE_ENTRY
         +0x000 DriverContext    : [4] (null)
         +0x020 Thread           : 0xffffe000`01665080 _ETHREAD
         +0x028 AuxiliaryBuffer  : (null)
         +0x030 ListEntry        : _LIST_ENTRY [ 0xffffe000`062ec0b8 - 0xffffe000`069170b8 ]
         +0x040 CurrentStackLocation : 0xffffe000`00000000 _IO_STACK_LOCATION
         +0x040 PacketType       : 0
         +0x048 OriginalFileObject : 0xffffe000`039455a0 _FILE_OBJECT
         +0x050 IrpExtension     : (null)
      +0x000 Apc              : _KAPC
      +0x000 CompletionKey    : (null)
The section of interest here is the Tail.Overlay sub-structure, which points back to the thread associated with the IRP, as well as the file object associated with it. Additionally, the Tail.Overlay.ListEntry is a linked list of IRPs that have something in common, which we will see momentarily.
Looking at the file object associated with the IRP, we can see the file information, but the interesting detail is in the CompletionContext field, which is of type _IO_COMPLETION_CONTEXT:
0: kd> dt nt!_FILE_OBJECT 0xffffe000`039455a0
   +0x000 Type             : 0n5
   +0x002 Size             : 0n216
   +0x008 DeviceObject     : 0xffffe000`01966ca0 _DEVICE_OBJECT
   +0x010 Vpb              : 0xffffe000`019689d0 _VPB
   +0x018 FsContext        : 0xffffc000`1203b140 Void
   +0x020 FsContext2       : 0xffffc000`112bf3c0 Void
   +0x028 SectionObjectPointer : 0xffffe000`03979f58 _SECTION_OBJECT_POINTERS
   +0x030 PrivateCacheMap  : 0xffffe000`02db1548 Void
   +0x038 FinalStatus      : 0n0
   +0x040 RelatedFileObject : 0xffffe000`0441d310 _FILE_OBJECT
   +0x048 LockOperation    : 0 ''
   +0x049 DeletePending    : 0 ''
   +0x04a ReadAccess       : 0x1 ''
   +0x04b WriteAccess      : 0 ''
   +0x04c DeleteAccess     : 0 ''
   +0x04d SharedRead       : 0x1 ''
   +0x04e SharedWrite      : 0x1 ''
   +0x04f SharedDelete     : 0 ''
   +0x050 Flags            : 0xc0040
   +0x058 FileName         : _UNICODE_STRING "\Development\Scratch\IOCPLeak\IOCPLeak\File.txt"
   +0x068 CurrentByteOffset : _LARGE_INTEGER 0x0
   +0x070 Waiters          : 0
   +0x074 Busy             : 0
   +0x078 LastLock         : (null)
   +0x080 Lock             : _KEVENT
   +0x098 Event            : _KEVENT
 +0x0b0 CompletionContext : 0xffffe000`00ea8470 _IO_COMPLETION_CONTEXT
   +0x0b8 IrpListLock      : 0
   +0x0c0 IrpList          : _LIST_ENTRY [ 0xffffe000`03945660 - 0xffffe000`03945660 ]
   +0x0d0 FileObjectExtension : (null)

0: kd> dt nt!_IO_COMPLETION_CONTEXT 0xffffe000`00ea8470
   +0x000 Port             : 0xffffe000`05248840 Void
   +0x008 Key              : (null)
The completion context tells us that the file handle is associated with an I/O completion port, whose address is provided as well. This is a structure of type _KQUEUE, which is essentially a queue of completion packets representing asynchronous I/O completions.
Inspecting the I/O Completion Port
Looking at the port’s details, we can see that there are 0 threads currently pulling from it, which is suspicious.
0: kd> dt nt!_KQUEUE 0xffffe000`05248840
   +0x000 Header           : _DISPATCHER_HEADER
   +0x018 EntryListHead    : _LIST_ENTRY [ 0xffffe000`07e366b8 - 0xffffe000`02a41628 ]
 +0x028 CurrentCount : 0
   +0x02c MaximumCount     : 8
   +0x030 ThreadListHead   : _LIST_ENTRY [ 0xffffe000`05248870 - 0xffffe000`05248870 ]
We can also see the completion packets enqueued into the port. This is a list of… IRPs, so we can enumerate them with the !list command and some expression magic. The first _LIST_ENTRY is at 0xffffe000`07e366b8, so we can go ahead and do this:
0: kd> !list -t nt!_IRP.Tail.Overlay.ListEntry.Flink -x "!irp @$extret" @@(#CONTAINING_RECORD(0xffffe000`07e366b8, nt!_IRP, Tail.Overlay.ListEntry))
I won’t bore you with the entire output, but it’s a long list of IRPs, matching the leaking IRPs that we have seen with !irpfind. At this point we have confirmed that the IRPs are not freed because they are enqueued to an I/O completion port, and the application falls behind in dequeueing them from the I/O completion port.
Conclusion
Indeed, a code inspection confirmed that the handle was associated with an I/O completion port — for no good reason — and the application wasn’t pulling completion packets with GetQueuedCompletionStatuslike it should. Instead, it used GetOverlappedResult like the sample code above. There’s no reason to use both approaches — the application should either use the I/O completion port and dequeue the completion packets, OR use GetOverlappedResult, but not both. After changing the code such that the handle is no longer associated with an IOCP, the non-paged pool leak went away. Whew!
This was a tough bug to chase, and the lesson really is that the Windows API makes it easy to shoot yourself in the foot if you’re not careful. Having a simple application exhaust non-paged pool is extremely dangerous and can have adverse effects on system stability.
I am posting short links and updates on Twitter as well as on this blog. You can follow me: @goldshtn

