Добро пожаловать в заключительную статью из серии о моем опыте разработки сервисов с Apache Camel . Я узнал, как реализовать конечные точки CXF с помощью Java DSL, убедился, что все работает с его инфраструктурой тестирования и интегрированным Spring Boot для внешней конфигурации. Для предыдущих статей, пожалуйста, смотрите следующее:
- Часть I: Вдохновение
- Часть II. Создание и тестирование маршрутов.
- Часть III: Интеграция Spring 4 и Spring Boot
Эта статья посвящена нагрузочному тестированию и инструментам для мониторинга производительности приложений. В конце июля меня попросили провести нагрузочное тестирование новых сервисов на базе Camel, которые я разработал. Причина моего клиента была проста: убедиться, что новые службы работают так же быстро, как и старые (на основе IBM Message Broker). Я отправил электронное письмо в список рассылки пользователей Camel с просьбой дать совет по нагрузочному тестированию.
Я готовлюсь к запуску приложения Camel / CXF / Spring Boot. Прежде чем я это сделаю, я хочу загрузить тест и убедиться, что он имеет ту же пропускную способность, что и система IBM Message Broker, которую он заменяет. Очевидно, старая система может выполнять только 6 одновременных подключений из-за проблем с удаленным подключением к базе данных.
Я хотел бы написать несколько тестов, которые делают одновременные запросы с разными данными. В идеале я мог бы написать их, чтобы они указывали на старую систему и выясняли, когда она падает. Тогда я мог бы указать им на новую систему и настроить ее соответственно. Если мне нужно ограничиться из-за проблем с удаленным подключением, я хотел бы знать, прежде чем мы перейдем к производству. Позволяет ли это JMeter или любые другие инструменты тестирования, связанные с Camel?
В ответ я получил предложения по использованию Apache’s ab и Gatling . Я слышал о Гатлинге раньше и решил попробовать.
Гатлинга
 Я не помню, где я впервые услышал о Гатлинге, но я знал, что у него был Scala DSL и использовал Akka под одеялом. Я создал новый проект с использованием архетипа Maven и приступил к разработке своего первого теста. Мой подход включал три этапа:
- Напишите тесты для запуска в текущей системе. Найдите количество одновременных запросов, которые заставляют его падать.
- Запустите тесты для новой системы и настройтесь соответственно.
- Отрегулируйте запросы, если есть проблемы с удаленным подключением от третьих лиц. Если мне нужно было регулировать запросы, я планировал использовать Camel Throttler .
Для разработки первого теста я начал с Gatling’s Recorder. Я настроил его на прослушивание порта 8000, изменил его DrugServiceITestна использование того же порта и запустил интеграционный тест. Это был отличный способ начать, потому что он записывал мои запросы в виде файлов XML и использовал чистый и лаконичный код.
В итоге я создал родительский класс для всех симуляций и назвал его AbstractSimulation. Это было удобно, потому что позволяло мне передавать параметры для всех значений, которые я хотел изменить.
import io.gatling.core.scenario.Simulation
import io.gatling.http.Predef._

/**
 * Base Simulation class that allows passing in parameters.
 */
class AbstractSimulation extends Simulation {

  val host = System.getProperty("host", "localhost:8080")
  val serviceType = System.getProperty("service", "modern")
  val nbUsers = Integer.getInteger("users", 10).toInt
  val rampRate = java.lang.Long.getLong("ramp", 30L).toLong

  val httpProtocol = http
    .baseURL("http://" + host)
    .acceptHeader("text/html,application/xhtml+xml,application/xml;q=0.9,*/*;q=0.8")
    .doNotTrackHeader("1")
    .acceptLanguageHeader("en-US,en;q=0.5")
    .acceptEncodingHeader("gzip, deflate")
    .userAgentHeader("Gatling 2.0")

  val headers = Map(
    """Cache-Control""" -> """no-cache""",
    """Content-Type""" -> """application/soap+xml; charset=UTF-8""",
    """Pragma""" -> """no-cache""")
}
The DrugServiceSimulation.scala class posts a SOAP request over HTTP.
import io.gatling.core.Predef._
import io.gatling.http.Predef._

import scala.concurrent.duration._

class DrugServiceSimulation extends AbstractSimulation {

  val service = if ("modern".equals(serviceType)) "/api/drugs" else "/axis2/services/DrugService"

  val scn = scenario("Drug Service :: findGpiByNdc")
    .exec(http(host)
    .post(service)
    .headers(headers)
    .body(RawFileBody("DrugServiceSimulation_request.xml")))

  setUp(scn.inject(ramp(nbUsers users) over (rampRate seconds))).protocols(httpProtocol)
}
To run tests against the legacy drug service with 100 users over 60 seconds, I used the following command:
mvn test -Dhost=legacy.server:7802 -Dservice=legacy -Dusers=100 -Dramp=60
The service property’s default is «modern» and determines the service’s URL. To run against the local drug service with 100 users over 30 seconds, I could rely on more defaults.
mvn test -Dusers=100
The name of the simulation to run is configured in pom.xml:
<plugin>
    <groupId>io.gatling</groupId>
    <artifactId>gatling-maven-plugin</artifactId>
    <version>${gatling.version}</version>
    <configuration>
        <simulationsFolder>src/test/scala</simulationsFolder>
        <simulationClass>com.company.app.${service.name}Simulation</simulationClass>
    </configuration>
    <executions>
        <execution>
            <phase>test</phase>
            <goals>
                <goal>execute</goal>
            </goals>
        </execution>
    </executions>
</plugin>
When the simulations were done running, the console displayed a link to some pretty snazzy HTML reports. I ran simulations until things started falling over on the legacy server. That happened at around 400 requests per second (rps). When I ran them against a local instance on my fully-loaded 2013 MacBook Pro, errors started flying at 4000/rps while 3000/rps performed just fine.
Jenkins
I configured simulations to run in Jenkins with the Gatling Plugin. It’s a neat plugin that allows you to record and compare results over time. After initial setup, I found I didn’t use it much. Instead, I created a Google Doc with my findings and created screenshots of results so my client had it in an easy-to-read format.
Data Feeders
I knew the results of the simulations were likely skewed, since the same request was used for all users. I researched how to make dynamic requests with Gatling and found Feeders. Using a JDBC Feader I was able make all the requests contain unique data for each user.
I added a feeder to DrugServiceSimulation, added it to the scenario and changed to use an ELFileBody so the feeder would substitute a ${NDC} variable in the XML file.
val feeder = jdbcFeeder("jdbc:db2://server:50002/database", "username", "password",
    "SELECT NDC FROM GENERICS")

val scn = scenario("Drug Service")
        .feed(feeder)
        .exec(http(host)
        .post(service)
        .headers(headers)
        .body(ELFileBody("DrugServiceSimulation_request.xml")))
I deployed the new services to a test server and ran simulations with 100 and 1000 users.
- 100 users over 30 seconds
- Neither service had any failures with 100 users. The max response time for the legacy service was 389 ms, while the new service was 172 ms. The mean response time was lower for the legacy services: 89 ms vs. 96 ms.
- 1000 users over 60 seconds
- When simulating 1000 users against the legacy services, 50% of the requests failed and the average response time was over 40 seconds. Against the new services, all requests succeeded and the mean response time was 100ms.
I was pumped to see the new services didn’t need any additional performance enhancements. These results were enough to convince my client that Apache Camel was going to be a performant replacement for IBM Message Broker.
I wrote more simulations for another service I developed. In doing so, I discovered I missed implementing a couple custom routes for some clients. The dynamic feeders made me stumble onto this because they executed simulations for all clients. After developing the routes, the dynamic data helped me uncover a few more bugs. Using real data to load test with was very helpful in figuring out the edge-cases our routes needed to handle.
Next, I started configuring logging for our new Camel services.
Logging with Log4j2
Log4j 2.0 had just been released and my experience integrating it in AppFuse motivated me to use it for this project. I configured Spring to use Log4j 2.0 by specifying the following dependencies. Note: Spring Boot 1.2+ has support for Log4j2.
<log4j.version>2.0</log4j.version>
...

<!-- logging -->
<dependency>
    <groupId>org.slf4j</groupId>
    <artifactId>slf4j-api</artifactId>
    <version>1.7.7</version>
</dependency>
<!-- Necessary to configure Spring logging with log4j2.xml -->
<dependency>
    <groupId>org.apache.logging.log4j</groupId>
    <artifactId>log4j-jcl</artifactId>
    <version>${log4j.version}</version>
</dependency>
<dependency>
    <groupId>org.apache.logging.log4j</groupId>
    <artifactId>log4j-slf4j-impl</artifactId>
    <version>${log4j.version}</version>
</dependency>
<dependency>
    <groupId>org.apache.logging.log4j</groupId>
    <artifactId>log4j-web</artifactId>
    <version>${log4j.version}</version>
</dependency>
I created a src/main/resources/log4j2.xml file and configured a general log, as well as one for each route. I configured each route to use «log:com.company.app.route.input» and «log:com.company.app.route.output» instead of «log:input» and «log:output». This allowed the log-file-per-route configuration you see below.
<?xml version="1.0" encoding="UTF-8"?>
<Configuration>
    <Properties>
        <Property name="fileLogDir">/var/log/app-name</Property>
        <Property name="fileLogPattern">%d %p %c: %m%n</Property>
        <Property name="fileLogTriggerSize">1 MB</Property>
        <Property name="fileLogRolloverMax">10</Property>
    </Properties>
    <Appenders>
        <Console name="Console" target="SYSTEM_OUT">
            <PatternLayout pattern="%d [%-15.15t] %-5p %-30.30c{1} %m%n"/>
        </Console>
        <RollingFile name="File" fileName="${fileLogDir}/all.log"
                         filePattern="${fileLogDir}/all-%d{yyyy-MM-dd}-%i.log">
            <PatternLayout pattern="${fileLogPattern}"/>
            <Policies>
                <SizeBasedTriggeringPolicy size="${fileLogTriggerSize}"/>
            </Policies>
            <DefaultRolloverStrategy max="${fileLogRolloverMax}"/>
        </RollingFile>
        <RollingFile name="DrugServiceFile" fileName="${fileLogDir}/drug-service.log"
                         filePattern="${fileLogDir}/drug-service-%d{yyyy-MM-dd}-%i.log">
            <PatternLayout pattern="${fileLogPattern}"/>
            <Policies>
                <SizeBasedTriggeringPolicy size="${fileLogTriggerSize}"/>
            </Policies>
            <DefaultRolloverStrategy max="${fileLogRolloverMax}"/>
        </RollingFile>
        <!-- Add a RollingFile for each route -->
    </Appenders>

    <Loggers>
        <Logger name="org.apache.camel" level="info"/>
        <Logger name="org.springframework" level="error"/>
        <Logger name="com.company.app" level="info"/>

        <Root level="error">
            <AppenderRef ref="Console"/>
            <AppenderRef ref="File"/>
        </Root>

        <Logger name="com.company.app.drugs" level="debug">
            <AppenderRef ref="DrugServiceFile"/>
        </Logger>
        <!-- Add a Logger for each route -->
    </Loggers>
</Configuration>
I did run into some issues with this configuration:
- The
/var/log/app-namedirectory has to exist or there’s a stacktrace on startup and no logs are written. - When deploy from Jenkins, I ran into permissions issues between deploys. To fix this, I chowned the directory before restarting Tomcat.
chown -R tomcat /var/log/app-name
/etc/init.d/tomcat start
Monitoring
 While I was configuring the new services on our test server, I also installed hawtio at /console. I had previously configured it to run in Tomcat when running «mvn tomcat7:run»:
<plugin>
    <groupId>org.apache.tomcat.maven</groupId>
    <artifactId>tomcat7-maven-plugin</artifactId>
    <version>2.2</version>
    <configuration>
        <path>/</path>
        <webapps>
            <webapp>
                <contextPath>/console</contextPath>
                <groupId>io.hawt</groupId>
                <artifactId>hawtio-web</artifactId>
                <version>1.4.19</version>
                <type>war</type>
                <asWebapp>true</asWebapp>
            </webapp>
        </webapps>
    </configuration>
    ...
</plugin>
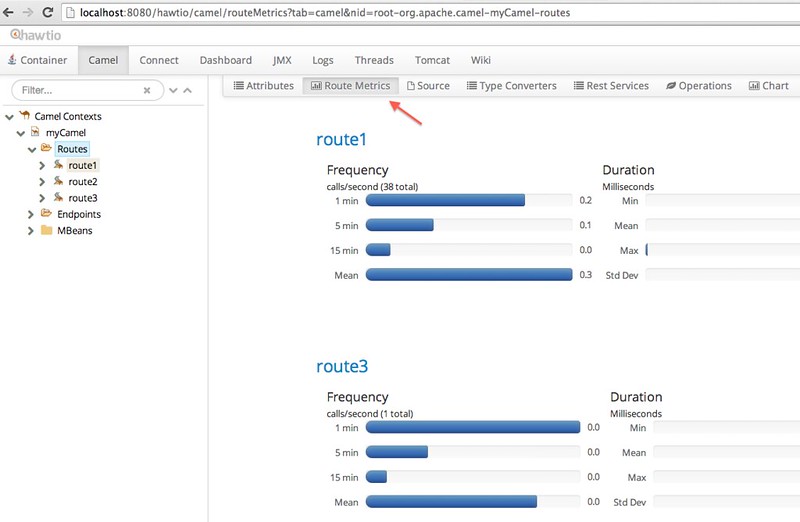
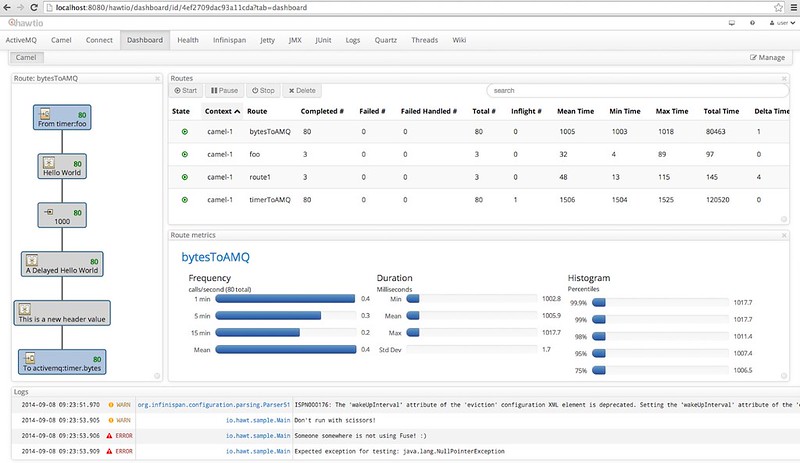
hawtio has a Camel plugin that’s pretty slick. It shows all your routes and their runtime metrics; you can even edit the source code for routes. Even though I used a Java DSL, my routes are only editable as XML in hawtio. Claus Ibsen has a good post on Camel’s new Metrics Component. I’d like to learn how to build a custom dashboard for hawtio — Claus’s example looks pretty nice.
The Spring Boot plugin for hawtio is not nearly as graphic intensive. Instead, it just displays metrics and their values in a table format.

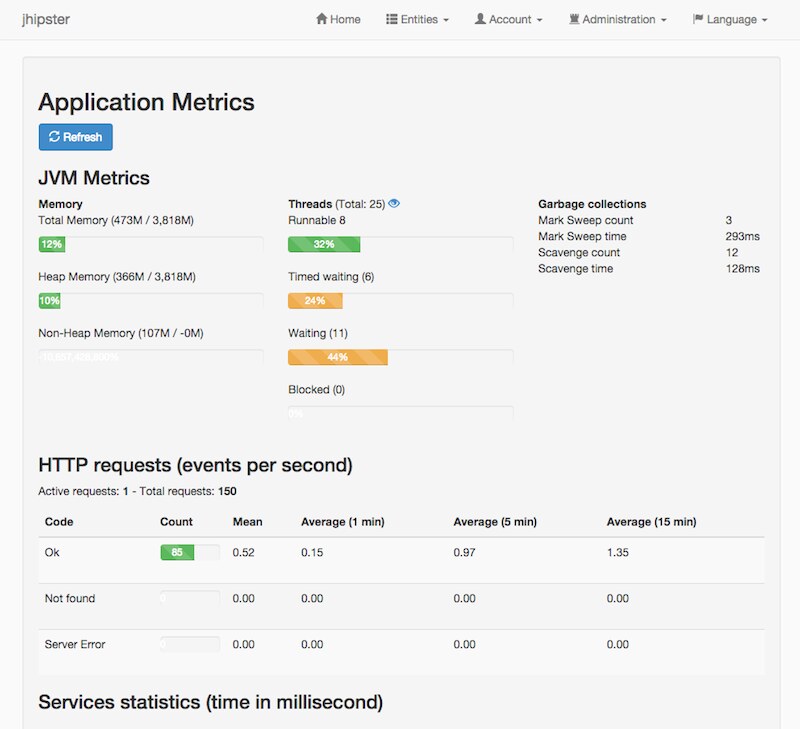
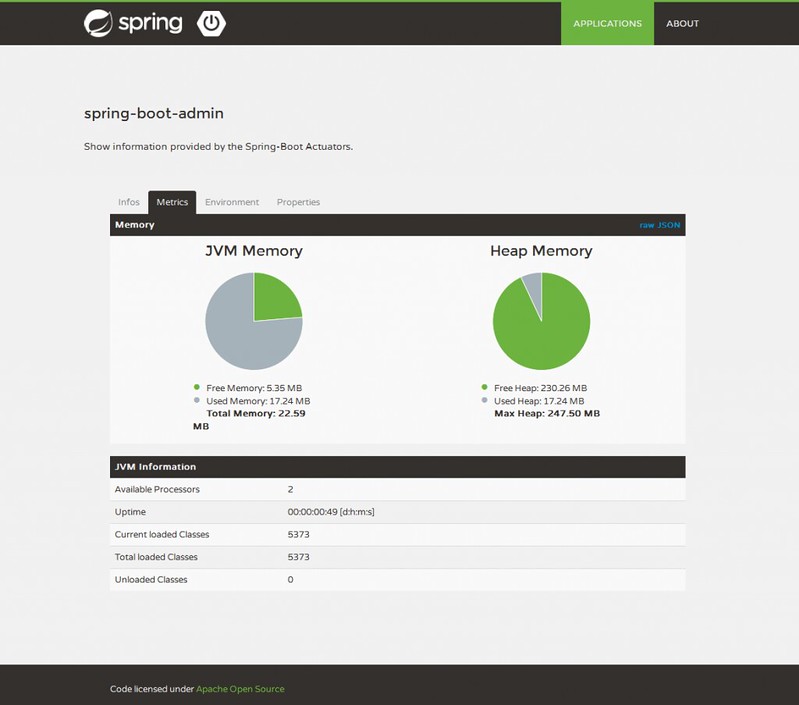
There’s some good-looking Spring Boot Admin UIs out there, notably JHipster’s and the one in spring-boot-admin. I hope the hawtio Spring Boot plugin gets prettier as it matures.
I wanted more than just monitoring, I wanted alerts when something went wrong. For that, I installed New Relic on our Tomcat server. I’m fond of getting the Monday reports, but they only showed activity when I was load testing.
I believe all these monitoring tools will be very useful once the app is in production. My last day with this client is next Friday, October 24. I’m trying to finish up the last couple of services this week and next. With any luck, their IBM Message Broker will be replaced this year.
Summary
This article shows how to use Gatling to load test a SOAP service and how to configure Log4j2 with Spring Boot. It also shows how hawtio can help monitor and configure a Camel application. I hope you enjoyed reading this series on what I learned about developing with Camel over the past several months. If you have stories about your experience with Camel (or similar integration frameworks), Gatling, hawtio or New Relic, I’d love to hear them.
It’s been a great experience and I look forward to developing solid apps, built on open source, for my next client. I’d like to get back into HTML5, AngularJS and mobile development. I’ve had a good time with Spring Boot and JHipster this year and hope to use them again. I find myself using Java 8 more and more; my ideal next project would embrace it as a baseline. As for Scala and Groovy, I’m still a big fan and believe I can develop great apps with them.
If you’re looking for a UI/API Architect that can help accelerate your projects, please let me know! You can learn more about my extensive experience from my LinkedIn profile.