Добро пожаловать, дорогой читатель, в другой пост нашей серии о стеке ELK для регистрации. В последнем посте мы говорили о LogStash, инструменте, который позволяет нам интегрировать данные из разных источников в разные места назначения, используя при этом преобразования в потоковой форме. В этом посте мы поговорим о ElasticSearch, индексаторе, основанном на Apache Lucene, который позволяет нам организовывать наши данные и осуществлять текстовый поиск по ним в масштабируемой инфраструктуре. Итак, давайте начнем с понимания того, как ElasticSearch организован внутри
Индексы, документы и осколки
На ElasticSearch у нас есть понятие индексов. Индекс похож на хранилище, где мы можем хранить наши данные в формате документов. Документ по терминологии ElasticSearch состоит из структуры данных, которые должны храниться, анализироваться и классифицироваться в соответствии с определением сопоставления, состоящим из ряда полей — важно отметить, что поле в ElasticSearch имеет одинаковый тип по всему Целый индекс, означающий, что у нас не может быть поля «телефон» с типом int в документе и строкой типа в другом.
В свою очередь, наши документы хранятся в шардах, которые делят данные на сегменты на основе правила — по умолчанию сегментация выполняется путем хеширования данных, но им также можно манипулировать вручную, что ускоряет поиск.
Итак, в двух словах, мы можем сказать, что порядок организации ElasticSearch выглядит следующим образом:
Индекс >> Документ (сопоставления / тип) >> Осколок
Эта организация используется пользователем для двух основных операций кластера: индексация и поиск.
И последнее, что нужно сказать о документах, это то, что они могут быть не только храниться как независимые, но и монтироваться в древовидной иерархии со связями между ними. Это полезно в сценариях, в которых мы можем использовать иерархический поиск, например, поиск товаров по их категориям.
индексирование
Индексирование — это действие ввода данных из внешнего источника в кластер. ElasticSearch — это текстовый индексатор, что означает, что он может анализировать текст только в простом формате, несмотря на то, что мы можем использовать кластер для хранения данных в формате base64 с помощью плагина. Позже мы увидим пример установки плагина, который представляет собой расширение, которое мы можем объединить для повышения удобства использования нашего кластера.
Когда мы индексируем наши данные, мы определяем, какие поля должны быть проанализированы, какой анализатор использовать, если полей по умолчанию недостаточно, и какие поля мы хотим хранить в кластере, чтобы данные могли использоваться в результате наших поисков. , Одна важная вещь, которую следует отметить в отношении операций индексирования, заключается в том, что, несмотря на то, что в нем выполняются CRUD-подобные операции, данные не обновляются и не удаляются в кластере, вместо этого создается новая версия, а старая версия помечается как удаленная.
Это важно принять к сведению, потому что, если он не настроен должным образом для очистки, что можно сделать с помощью конфигурации, которая разбивает осколки на сегменты и периодически объединяет сегменты, физически удаляя устаревшие документы в процессе, Кластер будет бесконечно увеличиваться в размере с «удаленными» старыми версиями наших данных, что делает поиск особенно медленным.
Все операции могут быть выполнены с помощью REST API, предоставляемого ElasticSearch, что мы увидим позже в этом посте.
Поиск
Другое, и, вероятно, наиболее важное действие в ElasticSearch — это поиск ранее проиндексированных данных. Как и действие индексирования, ElasticSearch также предоставляет REST API для поиска. API предоставляет очень широкий диапазон возможностей поиска, от базовых поисковых запросов до более сложных поисковых запросов, таких как иерархический поиск, поиск по синонимам, обнаружение языка и т. Д.
Весь поиск основан на системе оценок, где применяются формулы для сопоставления точности основанных документов с предоставленным запросом. Эта система оценки также может быть настроена.
По умолчанию поиск в кластере происходит в 2 этапа:
- На первом этапе главный узел отправляет запрос для всех узлов, а затем и фрагментов, извлекая только идентификаторы и оценки документов. Используя параметр size, который определяет максимальные результаты запроса, мастер выбирает более значимые документы на основе оценки;
- На втором этапе мастер отправляет запросы узлам на получение документов, выбранных на предыдущем этапе. После получения документов мастер наконец отправляет результат клиенту;
Наряду с этим типом поиска есть и другие режимы, такие как query_and_fetch . В этом режиме поиск выполняется одновременно на всех шардах, не только для получения идентификаторов и оценок, но и для возврата самих данных, ограниченных только параметром размера , который применяется для каждого шарда. В свою очередь, в этом режиме максимум возвращаемых результатов будет параметром размера плюс количество шардов.
Одна интересная особенность параметров конфигурации ElasticSearch — возможность сделать некоторые узлы эксклюзивными для операций запроса, а другие — сделать часть хранения, называемой узлами данных. Таким образом, когда мы выполняем запрос, наш запрос не должен выполняться по всему кластеру для формулирования результатов, что ускоряет поиск. В следующем разделе мы увидим немного больше о конфигурации кластера.
Возможности кластера
Когда мы говорим о кластере, мы говорим о масштабируемости, но мы также говорим о доступности. В ElasticSearch мы можем настроить репликацию сегментов, где данные реплицируются с помощью заданного фактора, поэтому мы не теряем наши данные в случае потери узла. Репликация также поддерживается кластером, поэтому, если мы потеряли реплику, сам кластер распространит новую реплику для другого узла.
Еще одна интересная особенность кластера — возможность открыть себя. В конфигурации по умолчанию, когда мы запускаем узел, он будет использовать режим обнаружения под названием Zen, который использует одноадресную и многоадресную рассылку для поиска других экземпляров на всех портах ОС. Если он обнаруживает другой экземпляр и имя кластера совпадает — это еще одно свойство конфигурации кластера. Все эти конфигурации могут быть сделаны в файлеasticsearch.yml , в папке config — он свяжется с экземпляром и установит новый узел для уже работающего кластера. Для этой функции есть другие режимы, включая обнаружение узлов с других серверов.
логирование
Читатель может подумать: «Лол, нужно ли мне все это для запуска стека журналов?».
Конечно, ElasticSearch — очень надежный инструмент, который можно использовать и в других решениях. Однако в нашем случае создания решения для централизованного анализа журналов ядро возможностей ElasticSearch хорошо подходит для этой задачи, в конце концов, мы говорим о текстовом анализе текстов журналов, для использования на сводных панелях, в отчетах или просто для реальных целей. время исследования данных.
Ну вот и заканчивается концептуальная часть нашего поста. Теперь перейдем к практике.
Руки вверх
Итак, без дальнейших задержек, давайте начнем практический. Для этого мы будем использовать предыдущую Java-программу, которую мы использовали в нашей лаборатории о LogStash. Код можно найти на GitHub, по этой ссылке . В этой программе мы использовали org.apache.log4j.net.SocketAppender из log4j, чтобы отправить все записи, которые мы делаем, в LogStash. Однако в этот момент мы просто печатали сообщения на консоли, а не отправляли в ElasticSearch. Прежде чем мы изменим это, давайте сначала запустим наш кластер.
Для этого сначала нужно скачать последнюю версию с сайта и распаковать архив. Давайте откроем терминал и наберем следующую команду:
curl https://download.elasticsearch.org/elasticsearch/elasticsearch/elasticsearch-1.4.4.tar.gz | tar -zx
После выполнения команды мы найдем новую папку с именем «asticsearch-1.4.4 «, созданную в той же папке, в которой мы запускаем нашу команду. В нашем примере мы создадим 2 копии этой папки в папке, которую мы называем «asticsearchcluster », где каждая из них будет представлять один узел кластера. Для этого мы запускаем следующие команды:
mkdir elasticsearchcluster

sudo cp -avr elasticsearch-1.4.4/ elasticsearchcluster/elasticsearch-1.4.4-node1/

sudo cp -avr elasticsearch-1.4.4/ elasticsearchcluster/elasticsearch-1.4.4-node2/
После того, как мы создали структуру кластера, нам больше не нужна исходная папка, поэтому мы удалим:
rm -R elasticsearch-1.4.4/
Теперь давайте наконец запустим наш кластер! Для этого мы открываем терминал, переходим в папку bin нашего первого узла (asticsearch-1.4.4-node1) и набираем : view sourc
./elasticsearch
Через несколько секунд мы видим, что наш первый узел включен:
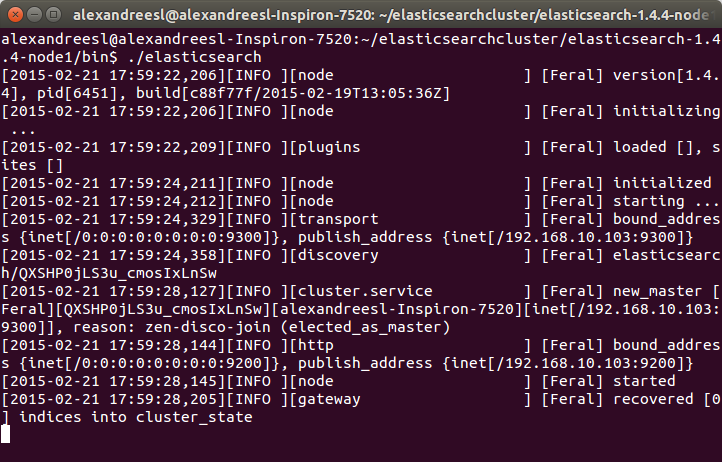
Ради интереса, мы можем увидеть имя «Feral» на имени узла в журнале. Все имена, сгенерированные инструментом, основаны на персонажах Marvel Comic. У IT-мира есть чувство юмора, а?
Теперь давайте начнем наш второй узел. В новом окне терминала перейдем к папке нашего второго узла (asticsearch-1.4.4-node2) и снова введите команду «./elasticsearch». Через несколько секунд мы видим, что узел также запущен:
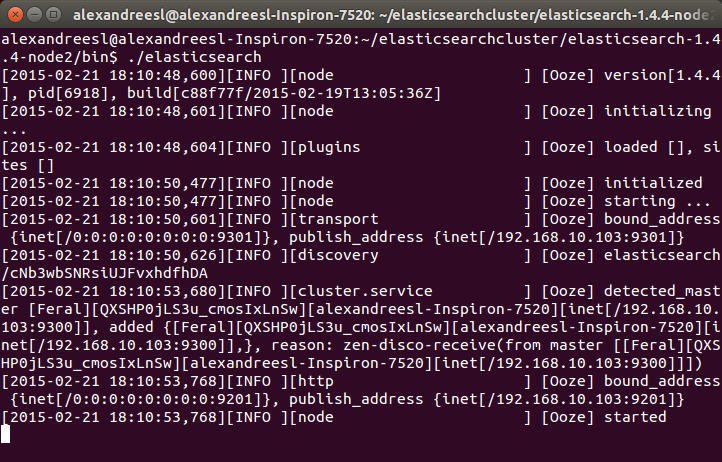
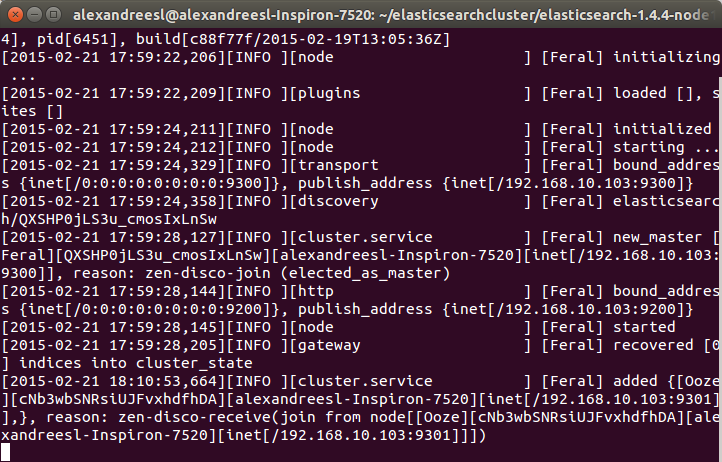
One interesting thing to notice is that our second node «Ooze», has a mention of comunicating with our other node, «Feral». That is the zen discover on the action, making the 2 nodes talk to each other and form a cluster. If we look again at the terminal of our first node, we can see another evidence of this bidirectional communication, as «Feral» has added «Ooze» to the cluster, as his role as a master node:
Now that we have our cluster set up, let’s adjust our logstash script to send the messages to the cluster. To do this, let’s change the output part of the script, to the following:
input {
log4j {
port => 1500
type => "log4j"
tags => [ "technical", "log"]
}
}

output {
stdout { codec => rubydebug }
elasticsearch_http {
host => "localhost"
port => 9200
index => "log4jlogs"
}
}
As we can see, we just included another output — we remained the console output just to check how logstash is receiving the data — including the ip and port where our ElasticSearch cluster will respond. We also defined the name of the index we want our logs to be stored. If this parameter is not defined, logstash will order elasticsearch to create a index with the pattern «logstash-%{+YYYY.MM.dd}».
To execute this script, we do like we did on the previous post, we put the new script on a file called «configelasticsearch.conf» on the bin folder of logstash, and run with the command:
./logstash -f configelasticsearch.conf
PS1: On the GitHub repository, it is possible to find this config file, alongside a file containing all the commands we will send to ElasticSearch from now on.
PS2: For simplicity sake, we will use the default mappings logstash provide for us when sending messages to the cluster. It is also possible to pass a elasticsearch’s mapping structure, which consists of a JSON model, that logstash will use as a template. We will see the mapping from our log messages later on our lab, but for satisfying the reader curiosity for now, this is what a elasticsearch’s mapping structure look like, for example for a document type «product»:
"mappings" : {
"product": {
"properties" : {

"variation" : { "type" : int }

"color"  : { "type" : "string" }

"code" : { "type" : int }

"quantity" : { "type" : int }

}
}
}
After some seconds, we can see that LogStash booted, so our configuration was a success. Now, let’s begin sending our logs!
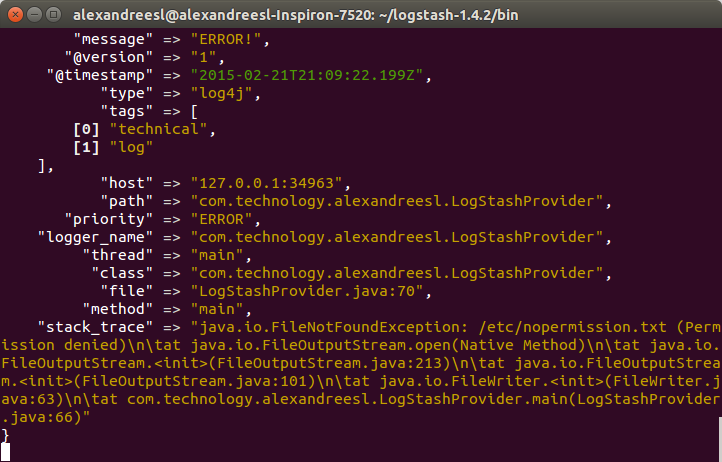
To do this, we run the program from our previous post, running the class com.technology.alexandreesl.LogStashProvider . We can see on the console of logstash, after starting the program, that the messages are going through the stack:
Now that we have our cluster up and running, let’s start to use it. First, let’s see the mappings of the index that ElasticSearch created for us, based on the configuration we made on LogStash. Let’s open a terminal and run the following command:
curl -XGET ‘localhost:9200/log4jlogs/_mapping?pretty’
On the command above, we are using ElasticSearch’s REST API. The reader will notice that, after the ip and port, the URL contains the name of the index we configured. This pattern for calls of the API is applied to most of the actions, as we can see below:
<ip>:<port>/<index>/<doc type>/<action>?<attributes>
So, after this explanation, let’s see the result from our call:
{
"log4jlogs" : {
"mappings" : {
"log4j" : {
"properties" : {
"@timestamp" : {
"type" : "date",
"format" : "dateOptionalTime"
},
"@version" : {
"type" : "string"
},
"class" : {
"type" : "string"
},
"file" : {
"type" : "string"
},
"host" : {
"type" : "string"
},
"logger_name" : {
"type" : "string"
},
"message" : {
"type" : "string"
},
"method" : {
"type" : "string"
},
"path" : {
"type" : "string"
},
"priority" : {
"type" : "string"
},
"stack_trace" : {
"type" : "string"
},
"tags" : {
"type" : "string"
},
"thread" : {
"type" : "string"
},
"type" : {
"type" : "string"
}
}
}
}
}
}
As we can see, the index «log4jlogs» was created, alongside the document type «log4j». Also, a series of fields were created, representing information from the log messages, like the thread that generated the log, the class, the log level and the log message itself.
Now, let’s begin to make some searches.
Let’s begin by searching all log messages which the priority was «INFO». We make this searching by running:
curl -XGET ‘localhost:9200/log4jlogs/log4j/_search?q=priority:info&pretty=true’
A fragment of the result of the query would be something like the following:
{
"took" : 12,
"timed_out" : false,
"_shards" : {
"total" : 5,
"successful" : 5,
"failed" : 0
},
"hits" : {
"total" : 18,
"max_score" : 1.1823215,
"hits" : [ {
"_index" : "log4jlogs",
"_type" : "log4j",
"_id" : "AUuxkDTk8qbJts0_16ph",
"_score" : 1.1823215,
"_source":{"message":"STARTING DATA COLLECTION","@version":"1","@timestamp":"2015-02-22T13:53:12.907Z","type":"log4j","tags":["technical","log"],"host":"127.0.0.1:32942","path":"com.technology.alexandreesl.LogStashProvider","priority":"INFO","logger_name":"com.technology.alexandreesl.LogStashProvider","thread":"main","class":"com.technology.alexandreesl.LogStashProvider","file":"LogStashProvider.java:20","method":"main"}
}

.

.

.
As we can see, the result is a JSON structure, with the documents that met our search. The beginning information of the result is not the documents themselves, but instead information about the search itself, such as the number of shards used, the seconds the search took to execute, etc. This kind of information is useful when we need to make a tuning of our searches, like manually defining the shards we which to use on the search, for example.
Let’s see another example. On our previous search, we received all the fields from the document on the result, which is not always the desired result, since we will not always use the whole information. To limit the fields we want to receive, we make our query like the following:
curl -XGET ‘localhost:9200/log4jlogs/log4j/_search?pretty=true’ -d ‘
{
«fields» : [ «priority», «message»,»class» ],
«query» : {
«query_string» : { «query» : «priority:info» }
}
}’
On the query above, we asked ElasticSearch to limit the return to only return the priority, message and class fields. A fragment of the result can be seen bellow:
.

.

.

{
"_index" : "log4jlogs",
"_type" : "log4j",
"_id" : "AUuxkECZ8qbJts0_16pr",
"_score" : 1.1823215,
"fields" : {
"priority" : [ "INFO" ],
"message" : [ "CLEANING UP!" ],
"class" : [ "com.technology.alexandreesl.LogStashProvider" ]
}
}

.

.

.
Now, let’s use the term search. On the term searches, we use ElasticSearch’s textual analysis to find a term inside the text of a field. Let’s run the following command:
curl -XGET ‘localhost:9200/log4jlogs/log4j/_search?pretty=true’ -d ‘
{
«fields» : [ «priority», «message»,»class» ],
«query» : {
«term» : {
«message» : «up»
}
}
}’
If we see the result, it would be all the log messages that contains the word «up». A fragment of the result can be seen bellow:
{
"_index" : "log4jlogs",
"_type" : "log4j",
"_id" : "AUuxkESc8qbJts0_16pv",
"_score" : 1.1545612,
"fields" : {
"priority" : [ "INFO" ],
"message" : [ "CLEANING UP!" ],
"class" : [ "com.technology.alexandreesl.LogStashProvider" ]
}
}
Of course, there is a lot more of searching options on ElasticSearch, but the examples provided on this post are enough to make a good starting point for the reader. To make a final example, we will use the «prefix» search. On this type of search, ElasticSearch will search for terms that start with our given text, on a given field. For example, to search for log messages that have words starting with «clea», part of the word «cleaning», we run the following:
curl -XGET ‘localhost:9200/log4jlogs/log4j/_search?pretty=true’ -d ‘
{
«fields» : [ «priority», «message»,»class» ],
«query» : {
«prefix» : {
«message» : «clea»
}
}
}’
If we see the results, we will see that are the same from the previous search, proving that our search worked correctly.
Kopf
The reader possibly could ask «Is there another way to send my queries without using the terminal?» or «Is there any graphical tool that I can use to monitor the status of my cluster?». As a matter of fact, there is a answer for both of this questions, and the answer is the kopf plugin.
As we said before, plugins are extensions that we can install to improve the capacities of our cluster. In order to install the plugin, first let’s stop both the nodes of the cluster — press ctrl+c on both terminal windows to stop — then, navigate to the nodes root folder and type the following:
bin/plugin -install lmenezes/elasticsearch-kopf
If the plugin was installed correctly, we should see a message like the one bellow on the console:
.

.

.

-> Installing lmenezes/elasticsearch-kopf...
Trying https://github.com/lmenezes/elasticsearch-kopf/archive/master.zip...
Downloading .....................................................................................................................................................................................................................................................................................................................................................................................................................................................................................................................................................................................................DONE
Installed lmenezes/elasticsearch-kopf into....
After installing on both nodes, we can start again the nodes, just as we did before. After the booting of the cluster, let’s open a browser and type the following URL:
http://localhost:9200/_plugin/kopf
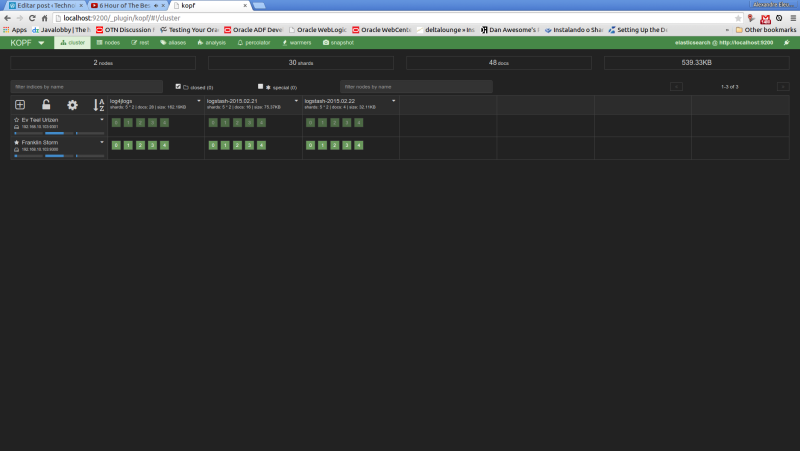
We will see the following web page of the kopf plugin, showing the status of our cluster, such as the nodes, the indexes, shard information, etc
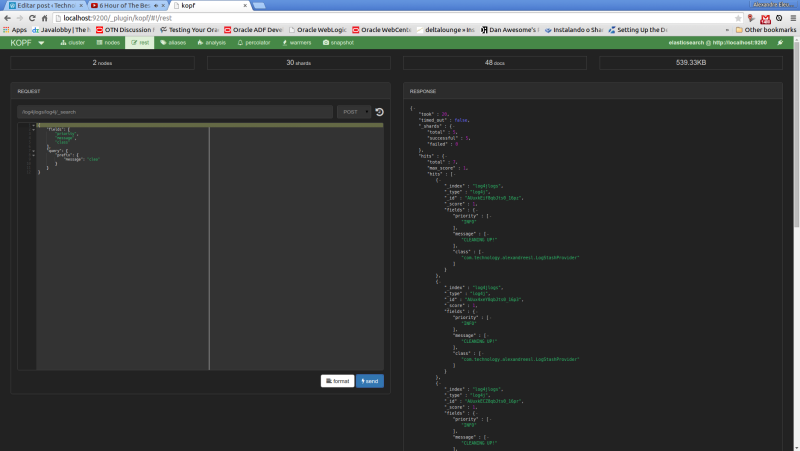
Now, let’s run our last example from the search queries on kopf. First, we select the «rest» option on the top menu. On the next screen, we select «POST» as the http method, include on the URL field the index and document type to narrow the results and on the textarea bellow we include our JSON query filters. The print bellow shows the query made on the interface:
Conclusion
And so we conclude our post about ElasticSearch. A very powerful tool on the indexing and analysis of textual information, the central stone on our ELK stack for logging is a tool to be used, not only on a logging analysis system, but on other solutions that his features can be useful as well.
So, our stack is almost complete. We can gather our log information, and the information is indexed on our cluster. However, a final piece remains: we need a place where we can have a more friendly interface, that allow us not only to search the information, but also to make rich presentations of the data, such as dashboards. That’s when it enters our last part of our ELK series and the last tool we will see, Kibana. Thank you for following me on another post, until next time.