Термин « граф свойств » стал обозначать атрибутивный многореляционный граф. То есть график, на котором ребра помечены, а вершины и ребра могут иметь любое количество свойств ключ / значение, связанных с ними. Пример графа свойств с двумя вершинами и одним ребром приведен ниже.
Графики свойств являются более сложными, чем общеизвестные стандартные однореляционные графы . Причина этого заключается в том, что существуют разные типы вершин (например, люди , компании , программное обеспечение ) и разные типы ребер (например, знает , works_for , импорт ). Сложности, добавленные этой структурой данных (и вообще многомерными графами, например графами RDF ), влияют на то, как определяются и оцениваются алгоритмы графов.
Стандартные учебники по теории графов, как правило, представляют общие алгоритмы, такие как различные центральности , геодезические , ассортативные микширования и т. Д. Эти алгоритмы обычно поставляются в комплекте с однореляционными наборами инструментов и средами (например, NetworkX , iGraph ).
Обычно люди желают таких алгоритмов графа, когда они начинают работать с программным обеспечением графа свойств. Меня много раз спрашивали:
«Поддерживает ли программное обеспечение графа свойств, над которым вы работаете, какой-либо из общих алгоритмов центральности? Например, PageRank , близость , промежуточность и т. Д.? »
Мой ответ на этот вопрос всегда:
«Что вы подразумеваете под центральностью в графе свойств?»
When a heterogeneous set of vertices can be related by a heterogeneous set of edges, there are numerous ways in which to calculate centrality (or any other standard graph algorithm for that matter).
- Ignore edge labels and use standard single-relational graph centrality algorithms.
- Isolate a particular “slice” of the graph (e.g. the knows subgraph) and use standard single-relational graph centrality algorithms.
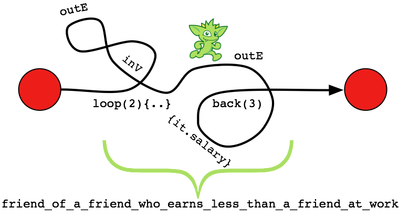
- Make use of abstract adjacencies to compute centrality with higher-order semantics.
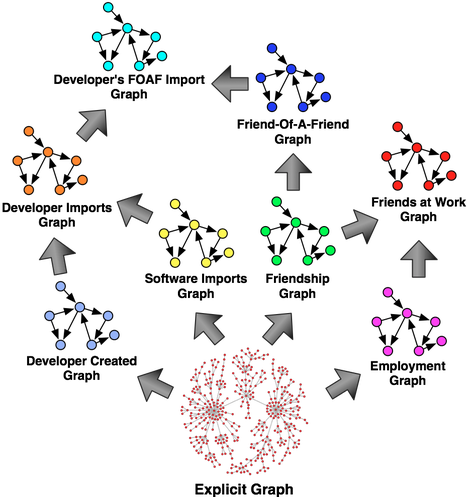
The purpose of this blog post is to stress point #3 and the power of property graph algorithms. In Gremlin, you can calculate numerous eigenvector centralities for the same property graph instance. At this point, you might ask: “How can a graph have more than one primary eigenvector?” The answer lies in seeing all the graphs that exist within the graph—i.e. seeing all the higher-order, derived, implicit, virtual, abstract adjacencies. Each line below exemplifies point #1, #2, and #3 in the list above, respectively. The code examples use the power method to calculate the vertex centrality rankings which are stored in the map m.
g.V.outE.inV.groupCount(m).loop(3){c++ < 10000} // point #1
g.V.outE[[label:'knows']].inV.groupCount(m).loop(4){c++ < 10000} // point #2
g.V.???.groupCount(m).loop(?){c++ < 10000} // point #3
The ??? on line 3 refers to the fact that ??? can be any arbitrary computation. For example, ??? can be:
outE[[label:'works_for']].inV.inE[[label:'works_for']].outV
outE[[label:'works_for']].inV[[name:'ACME']].inE[[label:'works_for']].outV
outE[[label:'develops']].inV.outE[[label:'imports']].inV[[name:'Blueprints']].back(7).outE[[label:'works_for']].inV.inE[[label:'works_for']].outV.outE[[label:'develops']].inV.outE[[label:'imports']].inV[[name:'Blueprints']].back(7)
The above expressions have the following meaning:
- Coworker centrality
- ACME Corporation coworker centrality
- Coworkers who import Blueprints into their software centrality
There are numerous graphs within the graph. As such, “what do you mean by centrality?”
These ideas are explored in more detail in the following article and slideshow.
Rodriguez M.A., Shinavier, J., “Exposing Multi-Relational Networks to Single-Relational Network Analysis Algorithms,” Journal of Informetrics, 4(1), pp. 29-41, Elsevier, doi:10.1016/j.joi.2009.06.004, 2009.


