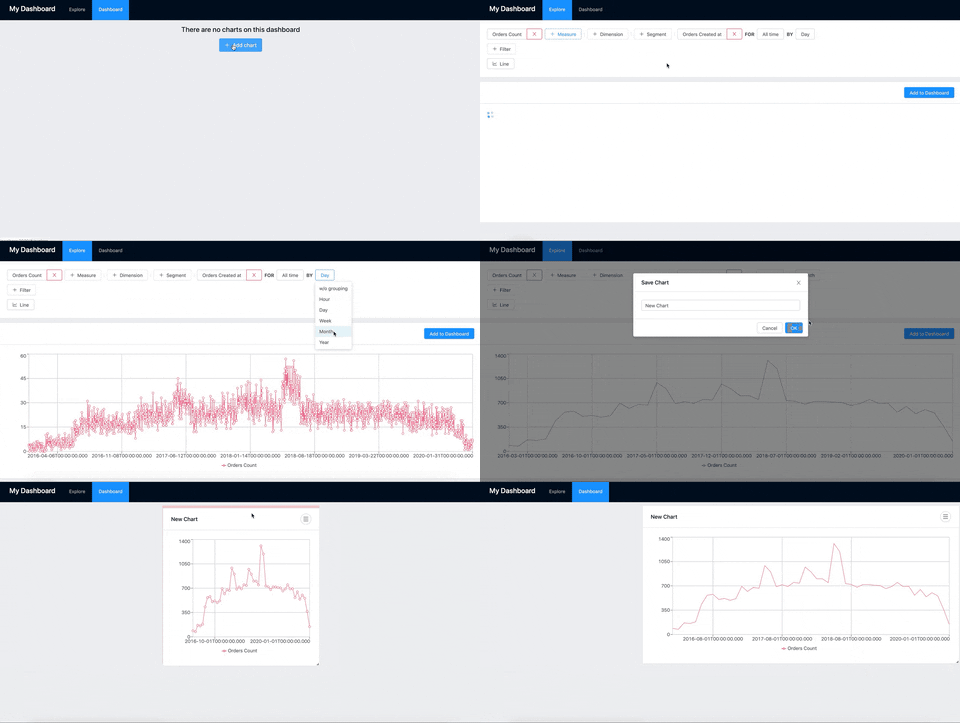
Это первая часть руководства по созданию инструментальных панелей и приложений динамической аналитики с использованием React , GraphQL и Cube.js. Демо онлайн доступно здесь .
В настоящее время мы видим аналитические панели и функции отчетов практически в любом приложении. За свою карьеру веб-разработчика я создал десятки различных панелей мониторинга от внутренних инструментов для измерения производительности приложений до порталов, ориентированных на клиентов, с интерактивными построителями отчетов и динамическими панелями мониторинга.
И я не могу сказать, что мне всегда нравился этот процесс. Несколько лет назад я рендерил весь HTML-код, включая информационные панели и диаграммы, на сервере, а затем пытался сделать его динамичным с помощью некоторого jQuery и множества хаков.
Бэкэнды были огромными монолитными приложениями, выполняющими множество вещей, включая обработку аналитики, которая часто оказывается медленной, неэффективной и трудной в обслуживании. Благодаря микросервисам, контейнерам, инфраструктурам веб-интерфейсов и множеству великолепных библиотек графиков сегодня проще и определенно веселее создавать аналитические инструментальные панели и построители отчетов.
В этом руководстве мы шаг за шагом узнаем, как создать аналитическое приложение с полным стеком, включая построитель отчетов и динамическую панель мониторинга. Мы создадим наше приложение в микросервисной архитектуре с внешним интерфейсом, отделенным от внутреннего. Для некоторых функций мы будем полагаться на сервисы AWS, но их можно легко заменить собственными микросервисами, о которых мы расскажем позже в этом руководстве.
You may also like: Cube.js: Ultimate Guide to the Open-Source Dashboard Framework.
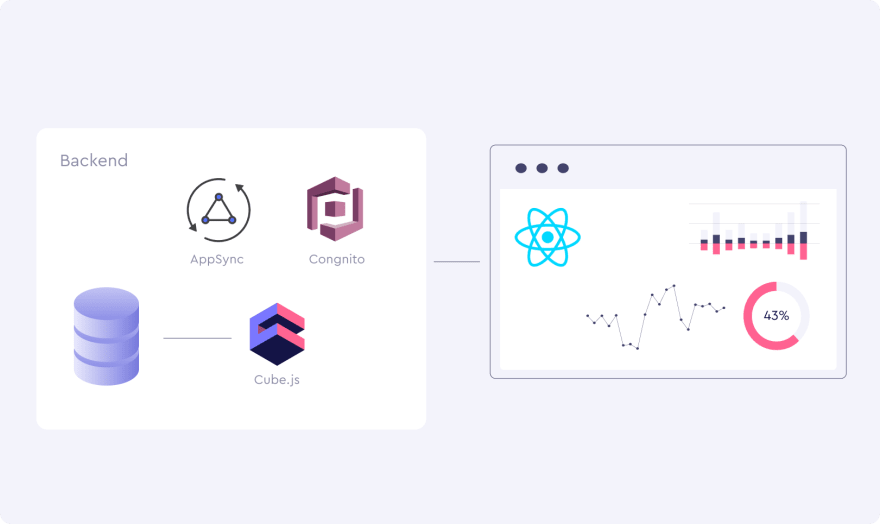
You can check out the final application we are going to build here. The diagram below shows the architecture of our app.
Let’s go through the backend first.
We’re going to store our data for the dashboard in PostgreSQL, a free and open source relational database. For those who don’t have Postgres, or would like to use a different database, I’ll put some useful links on how to do the same set up for different databases, such as MongoDB, later in this tutorial.
Next, we’ll install Cube.js and connect it to the database. Cube.js is an open source framework for building analytical web applications. It creates an analytics API on top of the database and handles things like SQL organization, caching, security, authentication, and much more.
We’ll also use AWS Cognito for user registrations and sign-ins and AWS AppSync as a GraphQL backend. Optionally, you can use your own authentication service, as well as GraphQL backend. To keep things simple, we’ll rely on AWS services for the purpose of this tutorial.
The frontend is a React application. We’re going to use Cube.js playground to generate a React dashboard boilerplate with a report builder and a dashboard. It uses Create React App under the hood to create all the configuration and additionally wires together all the components to work with Cube.js API and a GraphQL backend.
Finally, for the visualizations, we’ll use Recharts, a powerful and customizable React-based charting library.
Setting Up a Database and Cube.js
The first thing we need to have in place is a database. We’ll use a PostgreSQL database, but any other relational database should work fine as well. If you want to use MongoDB, you’d need to add a MongoDB Connector for BI. It allows you to execute SQL code on top of your MongoDB data. It can be easily downloaded from the MongoDB website.
One more thing to keep in mind is a replication. It is considered a bad practice to run analytics queries against your production database mostly because of the performance issues. Cube.js can dramatically reduce the amount of a database’s workload, but still, I’d recommend connecting to the replica.
If you don’t have any data for the dashboard, you can download our sample e-commerce Postgres dataset.
$ curl http://cube.dev/downloads/ecom-dump.sql > ecom-dump.sql
$ createdb ecom
$ psql --dbname ecom -f ecom-dump.sql
Now, let’s install Cube.js and create a backend service. Run the following commands in your terminal:
$ npm install -g cubejs-cli
$ cubejs create react-dashboard -d postgres
We’ve just created a new Cube.js service, configured to work with the Postgres database. Cube.js uses environment variables starting with CUBEJS_ for configuration. To configure the connection to our database, we need to specify the DB type and name. In the Cube.js project folder replace the contents of .env with the following:
CUBEJS_API_SECRET=SECRET
CUBEJS_DB_TYPE=postgres
CUBEJS_DB_NAME=ecom
If you are using a different database, please refer to this documentation on how to connect to a database of your choice.
Now, let’s run the Cube.js Playground. It will help us to build a simple data schema, test out the charts and then generate a React dashboard boilerplate. Run the following command in the Cube.js project folder:
$ node index.jsNext, open http://localhost:4000 in your browser to create a Cube.js data schema.
Cube.js uses a data schema to generate SQL code, which will be executed in your database. The data schema is not a replacement for SQL; it is designed to make SQL reusable and give it a structure while preserving all of its power. Basic elements of the data schema are measures and dimensions.
Measure is referred to as quantitative data, such as the number of units sold, number of unique visits, profit, and so on.
Dimension is referred to as categorical data, such as state, gender, product name, or units of time (e.g., day, week, month).
The data schema is JavaScript code, which defines measures and dimensions and how they map to SQL queries. Here is an example of the schema, which can be used to describe users’ data.
cube(`Users`, {
  sql: `SELECT * FROM users`,

  measures: {
    count: {
      sql: `id`,
      type: `count`
    }
  },

  dimensions: {
    city: {
      sql: `city`,
      type: `string`
    },

    signedUp: {
      sql: `created_at`,
      type: `time`
    },

    companyName: {
      sql: `company_name`,
      type: `string`
    }
  }
});
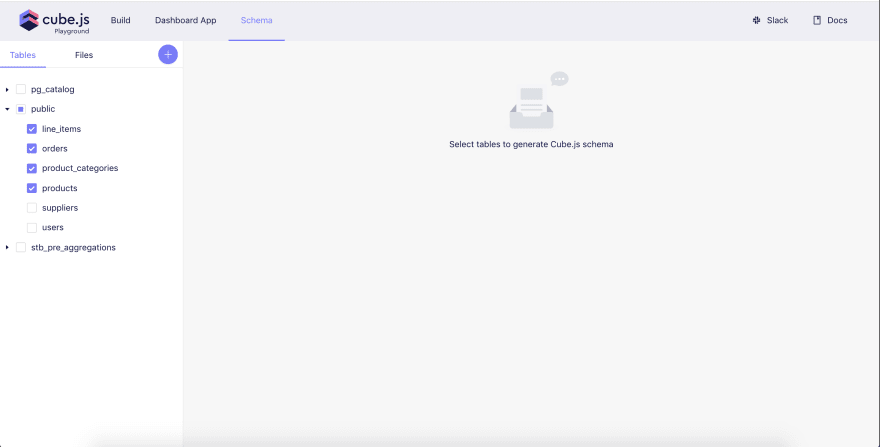
Cube.js can generate a simple data schema based on the database’s tables. Let’s select the orders, line_items, products, and product_categories tables and click “Generate Schema.” It will generate four schema files, one per table.
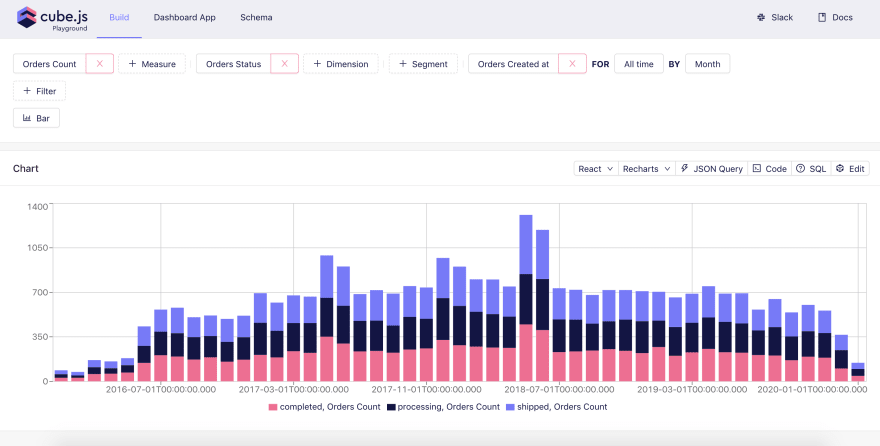
Once the schema is generated, we can navigate to the Build tab and select some measures and dimensions to test out the schema. The Build tab is a place where you can build sample charts with different visualization libraries and inspect how that chart was created, starting from the generated SQL all the way up to the JavaScript code to render the chart. You can also inspect the JSON query, which is sent to Cube.js backend.
Generating a Dashboard Template
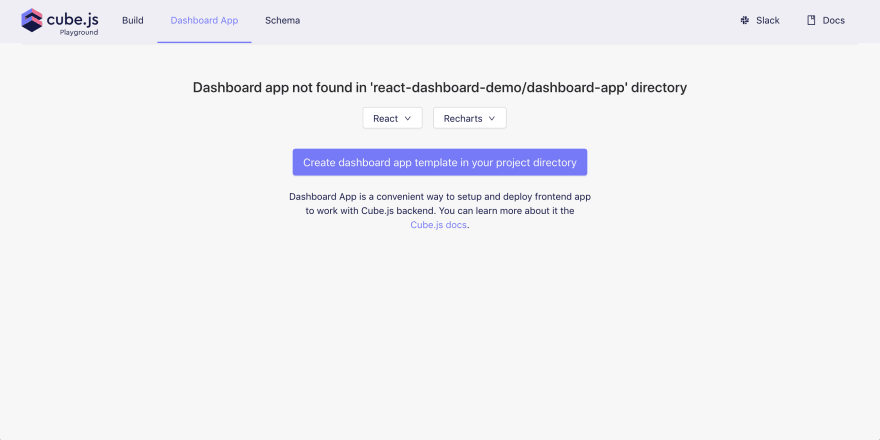
The next step is to generate a template of our frontend application. Navigate to Dashboard App, select React and Recharts, and click on the Create dashboard app button.
It could take a while to generate an app and install all the dependencies. Once it is done, you will have a dashboard-app folder inside your Cube.js project folder. To start a frontend application, either go to the “Dashboard App” tab in the playground and hit the “Start” button, or run the following command inside the dashboard-app folder:
$ npm startMake sure the Cube.js backend process is up and running since our frontend application uses its API. The frontend application is running on http://localhost:3000. If you open it in your browser, you should be able to see an Explore tab with a query builder and an empty Dashboard tab. Feel free to play around to create some charts and save them to the dashboard.
Our generated application uses the Apollo GraphQL client to store dashboard items into local storage. In the next part, we will add persistent storage with AWS AppSync, as well as user authentication with AWS Cognito.
