ГИС, аббревиатура, которая приносит радость некоторым и вселяет страх в сердце тех, кто не заинтересован в покупке дорогого программного обеспечения. К счастью, бой или бегство могут быть сохранены на другой день, потому что вам не нужно быть ГИС-джокером с кучей денег, чтобы работать с пространственными данными и создавать прекрасные графики. Компьютер и подключение к интернету должны быть все, что вам нужно. В этом посте я покажу, как
- Подготовьте машину к использованию R для работы с геопространственными данными.
- Опишите, какой тип данных можно использовать, и некоторые интересные источники бесплатных данных ГИС
- Используйте данные из Департамента природных ресурсов Вашингтона, чтобы сгенерировать несколько симпатичных сюжетов, используя пример сценария
Готовим Вашу Машину
Во-первых, если у вас нет R на вашем компьютере, вы можете скачать его здесь . Более того, загрузите Rstudio, невероятно эффективный и простой в использовании интерфейс для работы с R, доступный здесь . Работа с R studio настоятельно рекомендуется и будет более четко изложена в этом посте. R не поддерживает работу с пространственными данными прямо из коробки, поэтому необходимо загрузить несколько пакетов, чтобы R работал с пространственными данными. Требуются два пакета: «sp» и «rgdal». Мы также будем использовать третий пакет ‘rgeos’ для некоторых фантастических геопространственных трюков. К сожалению, последняя версия пакета sp в настоящее время не совместима с последней версией R — v 3.0. Когда установка Rstudio предложит установить R, загрузите версию 2.15.3.
First intall and open RStudio. To add the required packages open RStudio and click on the “packages” tab in the lower right hand panel of the interface. The lower right window will show a list of packages that come with a standard download of RStudio. Some of the packages will have check marks next to them, this means that those libraries are loaded and ready to be used. If you just downloaded R for the first time sp and rdgal will not be on that list, click on the “Install Packages” button. Make sure the “Install from” option is set to “Repository (CRAN)” and type “sp” into the “Packages” space. Check the “Install Dependencies” option and download! By checking the “Install Dependencies” option packages sp needs to function properly will automatically be downloaded. Download rgdal in the same way and you have the tools needed to start! Download rgeos as well and you can run the portion of the example script that uses centroids.
Sp и Rgdal способности и источники данных
Rgdal — это то, что позволяет R понять структуру шейп-файлов, предоставляя функции для чтения и преобразования пространственных данных в простые для работы с R-фреймами данных. Sp обеспечивает преобразование и проекцию данных и предоставляет функции для работы с загруженными объектами пространственного многоугольника. Следует учитывать, что это мощные библиотеки, которые позволяют R использовать файлы .shp. Геологическая служба США , то Национальный парк Serivce, и штат Вашингтон Департамент природных ресурсов являются всего лишь несколькими примерами организаций , которые делают огромные запасы пространственных данных , доступными для общественности.
Пример скрипта
В следующем коде используются пространственные данные области инвентаризации ресурсов водораздела (WRIA) из Департамента экологии штата Вашингтон. Этот набор данных содержит информацию о различных областях управления водными ресурсами штата Вашингтон. Какая информация хранится в шейп-файлах, будет исследована с помощью R! Если функция или какой-либо код выглядят загадочно, попробуйте »? mysteriousFunctionName () »и удобная документация объяснят вам, что делает функция. Давайте начнем использовать R для исследования данных. Просто скопируйте и вставьте следующий код в RStudio:
# WRIA example by Steven Brey @ mazamascience.com

# load the required libraries
library(sp)
library(rgdal)

# First load the data from the Washington department of ecology website

# Data source
#
# Data: ftp://www.ecy.wa.gov/gis_a/hydro/wria.zip
# Metadata: http://www.ecy.wa.gov/services/gis/data/hydro/wria.htm

# Create a directory for the data
localDir <- 'R_GIS_data'
if (!file.exists(localDir)) {
  dir.create(localDir)
}
# Download the 5mb file of WRIA data
url <- 'ftp://www.ecy.wa.gov/gis_a/hydro/wria.zip'
file <- paste(localDir,basename(url),sep='/')
if (!file.exists(file)) {
  download.file(url, file)
  unzip(file,exdir=localDir)
}
# Show the unzipped files
list.files(localDir)

# layerName is the name of the unzipped shapefile without file type extensions
layerName <- "WRIA_poly"
# Read in the data
data_projected <- readOGR(dsn=localDir, layer=layerName)

# What is this thing and what's in it?
class(data_projected)
slotNames(data_projected)
# It's an S4 "SpatialPolygonsDataFrame" object with the following slots:
# [1] "data"        "polygons"    "plotOrder"   "bbox"        "proj4string"

# What does the data look like with the default plotting command?
plot(data_projected)
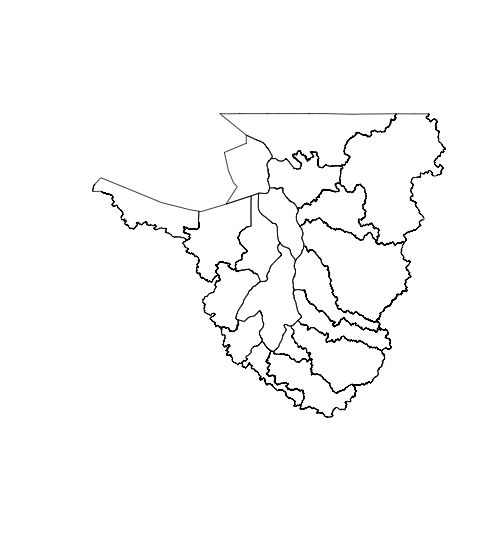
Мы еще не знаем, что содержат различные «слоты», кроме Holy Smokes! Этот сюжет выглядит как Вашингтон. Сюжет не очень хорош (пока), но всего за несколько строк кода вы уже можете создать примитивную карту полигонов в этом наборе данных. Тот факт, что этот объект является ~ DataFrame, предполагает, что мы можем рассматривать его как R-фрейм данных. Давайте узнаем, какие у него есть данные, выберите интересные столбцы и работаем только с ними. (Не удивительно, что в слоте @data существует фактический фрейм данных, но многие методы фреймов данных также работают со всем объектом.)
Мы перейдем к проблеме переименования переменных, перепроектирования данных в «longlat» и последующего сохранения данных в файл .RData для легкой загрузки в будущем.
# Could use names(data_projected@data) or just:
names(data_projected)
#["WRIA_ID"    "WRIA_NR"    "WRIA_AREA_" "WRIA_NM"    "Shape_Leng" "Shape_Area"

# Identify the attributes to keep and associate new names with them
attributes <- c("WRIA_NR", "WRIA_AREA_", "WRIA_NM")
# user friendly names
newNames <- c( "number", "area", "name")

# Subset the full dataset extracting only the desired attributes
data_projected_subset <- data_projected[,attributes]

# Assign the new attribute names
names(data_projected_subset) <- newNames

# Create a dataframe name (potentially different from layerName)
data_name <- "WRIA"

# Reproject the data onto a "longlat" projection and assign it to the new name
assign(data_name,spTransform(data_projected_subset, CRS("+proj=longlat")))

# NOTE: If using assign() above gave you an error it is likely the version of
# NOTE: R you are using does not currently support the sp package. Use R
# NOTE: 2.15.3 instead.

# The WRIA dataset is now projected in latitude longitude coordinates as a
# SpatialPolygonsDataFrame.  We save the converted data as .RData for faster
# loading in the future.
save(list=c(data_name),file=paste(localDir,"WAWRIAs.RData",sep="/"))

# Upon inspecting the metadata you can see that the first 19 areas in WRIA
# surround Puget Sound. The names of the first 19 watersheds in WRIA are
WRIA$name[1:19]

# For fun, save a subset including only only these 19 areas
PSWRIANumbers <- c(1:19)
WRIAPugetSound <- WRIA[WRIA$number %in% PSWRIANumbers,]
# Sanity check, plot WRIAPugetSound to make sure it looks like the subset we want
plot(WRIAPugetSound)

# Save Puget Sound data as an RData file which we can quickly "load()"
data_name <- "WRIAPugetSound"
save(list=c(data_name),file=paste(localDir,"WRIAPugetSound.RData",sep="/"))
Теперь мы сохранили данные WRIA и WRIAPugetSound в виде R пространственных объектов, которые можно легко загрузить! Теперь начинается настоящее веселье, те из вас, кто ждал красивых сюжетов, скоро будут вознаграждены. Оставшаяся часть сценария представляет собой пошаговый анализ забавного анализа и создания основных фигур, которые легко можно выполнить с помощью преобразованных данных WRIA.
# Load the data that was converted to SpatialPolygonsDataFrame
# NOTE: This can be skipped (but does not have to be) if the spatial
# NOTE: objects are still in your workspace.

# Load and show the names of the attributes in WRIA
file <- paste(localDir,"WAWRIAs.RData",sep="/")
load(file)
names(WRIA)

file <- paste(localDir,"WAWRIAs.RData",sep="/")
load(file)
names(WRIAPugetSound)

# Sweet.  We can see that this is the WRIA dataset we saved earlier

# NOTE: For more advanced users, slotNames(WRIA) will list the structures
# in WRIA. Using the @ command allows you to grab a particular slot from the
# spatial object.  If you really want the HUGE AND GORY details of what's
# in this object, you can examine the full structure with str(WRIA).

# Here is how you would extract the contents of slots for easier use.
WriaData <- WRIA@data
WriaBbox <- WRIA@bbox

# We have a pretty good idea of what kind of data we are working with
# and what it looks like. Now its time for the data to answer some
# questions and tell us a story.

# What is the biggest water resource area in Washington?
maxArea <- max(WRIA$area)
# Create a 'mask' identifying the biggest area so we can find out its name
# NOTE:  Eaach 'mask' we create is a vector of TRUE/FALSE values that we
# NOTE:  will use to subset the dataframe.
biggestAreaMask <- which(WRIA$area == maxArea)
biggestAreaName <- WRIA$name[biggestAreaMask]
biggestAreaName

# Create a SpatialPolygonsDataFrame subset
biggestArea <- WRIA[biggestAreaMask,]

# plot biggest area in blue with a title
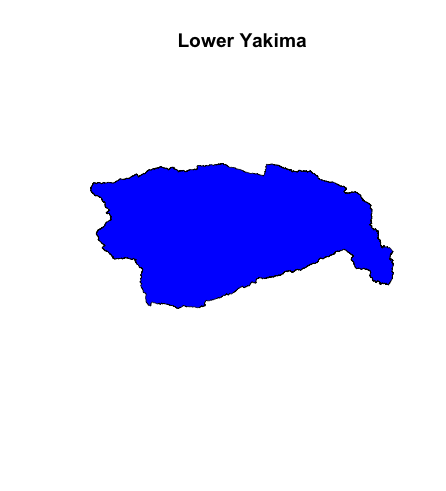
plot(biggestArea, col="blue")
title(biggestAreaName)

# NOTE: Many more plot arguments can be explored by investigating
# NOTE: the "SpatialPolygons" "plot-method" in the sp package
# I have heard of a water resource management area in Washington State
# called Pend Oreille.  Where is it located in this dataframe?
which(WriaData$name == "Pend Oreille")

# Now we have isolated the watershed with the largest area as well as the
# fabled Pend Oreille.  Lets figure out how to highlight these regions when
# plotting all  regions. I have also heard that Lake Chelan is Beautiful.
# Lets isolate it as well.

# Each of the following makes a spatialPolygonsDataFrame subset, selecting
# a specific region based on some selected attribute in WRIA.

WRIA_puget <- WRIA[WRIA$number %in% PSWRIANumbers,]
WRIA_chelan <- WRIA[WRIA$name == "Chelan",]
WRIA_Pend_Oreille <- WRIA[WRIA$name == "Pend Oreille",]

# Check out what they look like plotted individually
plot(WRIA_puget)
plot(WRIA_chelan)
plot(WRIA_Pend_Oreille)

# For fun we will make 8 different watersheds 8 different colors!
watersheds <- c(1:8)
watershed_colors <- c("burlywood1","forestgreen","burlywood3","darkolivegreen3",
                      "cadetblue4","sienna3","cadetblue3","darkkhaki")

watershed_color_variation <- WRIA[WRIA$number %in% watersheds,]

# Plot some of the created spatial objects together
plot(WRIA)
plot(WRIA_puget,add=TRUE,col="navy")
plot(WRIA_chelan,add=TRUE,col="red2")
plot(watershed_color_variation, add=TRUE, col=watershed_colors)
plot(WRIA_Pend_Oreille,add=TRUE,col="red4")

# NOTE:  gCentroid is from the 'rgeos' package
library(rgeos)
# Find the center of each region and label lat and lon of centers
centroids <- gCentroid(WRIA, byid=TRUE)
centroidLons <- coordinates(centroids)[,1]
centroidLats <- coordinates(centroids)[,2]

# Find regions with center East of -121 longitude (East of Cascade mountains)
eastSideMask <- centroidLons > -121

# Create spatialPolygonsDataFrame for these regions
WRIA_nonPacific <- WRIA[eastSideMask,]

# Find watersheds with area 75th percentile or greater
basinAreaThirdQuartile <- quantile(WRIA$area,0.75)
largestBasinsMask <- WRIA$area >= basinAreaThirdQuartile

WRIA_largest <- WRIA[largestBasinsMask,]

# To get legend and labels to fit on the figure we can change the size of the
# area plotting. bbox(WRIA) shows the bounding lat and long of WRIA.
bBox <- bbox(WRIA)
ynudge <- 0.5
xnudge <- 3
xlim <- c(bBox[1,1] + xnudge , bBox[1,2] - xnudge)
ylim <- c(bBox[2,1] - ynudge, bBox[2,2] )

# Plot some of the different spatial objects and show lat-long axis,
# label watersheds
plot(WRIA,axes=TRUE,xlim=xlim,ylim=ylim)
plot(WRIA_nonPacific,add=TRUE,col="red")
plot(WRIA_puget,add=TRUE,col="navy")
plot(WRIA_largest,add=TRUE,density=20,col="green1")
text(centroidLons, centroidLats, labels=WRIA$number, col="blue", cex=.7)

title(main="Washington Watersheds")
labels <- c("Puget Sound Watersheds", "Washington's biggest watersheds",
            "drain to Pacific via Columbia river")
label_cols <- c("navy","green1","red")
legend("bottomleft", NULL, labels, fill=label_cols, density, bty="n", cex=.8)

Кому нужно дорогое программное обеспечение ГИС?
Еще одним полезным пакетом для построения пространственных данных является библиотека «maptools», доступная в репозитории Cran. Приведенный ниже код требует наличия пакета maptools, поэтому убедитесь, что он установлен перед запуском кода.
# Lets get a taste of what some of the built in plotting functions in the map
# tools package can do

# First load
library("maptools")

allWashingtonAreas <- spplot(WRIA, zcol="area", identify=TRUE)

# by saving as object more than one plot can be shown on a panel
pugetSoundAreas <- spplot(WRIA_puget, zcol="area", identify=TRUE)

# Open new plot frame
frame()
print(allWashingtonAreas, position=c(0,.5,.5,1), more=T)
print(pugetSoundAreas, position=c(.5,.5,1,1), more=T)
Эти примеры только показывают поверхность потенциала построения и анализа, доступного в R, используя пакеты sp, rgdal и maptools. Рекомендуется изучить сюжетные методы в sp, прежде чем тратить много времени на создание собственного сюжета.
Поздравляем! Теперь вы знаете, как узнать, что находится в геопространственных данных, и как составлять графики, используя R.
Счастливого отображения!

